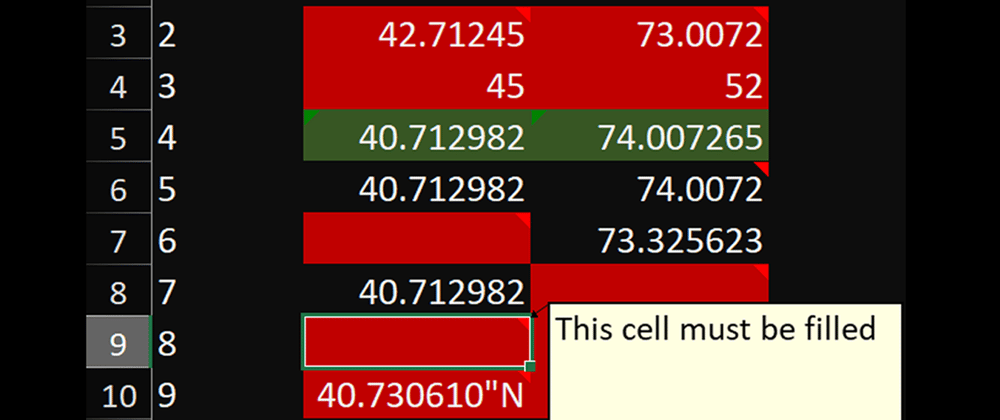
A few days ago, I received an excel file with geological data from my client. The file contains site ID, latitude and longitude, which looks something like this:
My client's goals are:
- Highlight the empty cells.
- Unify the longitude and latitude to 6 decimal places, and fix the errors or highlight them.
By looking at the demo file, it may seems like a simple task, but the actual file contains over 10,000 lines of data, and my client wants it done ASAP, so I have to do it my way, with Python.
Setup
I choose openpyxl over xlwings. They are both great python libraries to read/write excel files. However, in my experience openpyxl is faster when dealing with large datasets, and it does not rely on the Excel program.
(Note: xlwings shines when used in the right circumstances, like writing interactive program.
Let's install openpyxl first.
pip install openpyxl
Since this is a very simple program, we will need a geo.py for the main loop, a reviewer.py for data validating and excel editing.the main loop, a reviewer.py for data validating and excel editing.
Read data into Python (geo.py)
First, we need to read the file's content. Open geo.py and write the following code:
from openpyxl import load_workbook, workbook
from reviewer import reviewer_geo

input_file_path = 'Geo Demo.xlsx'
workbook = load_workbook(input_file_path)
worksheet = workbook['Sheet1']

col_latitude = 'B'
col_longitude = 'C'
This will load Sheet1 from Geo Demo.xlsx. You can also use worksheet = workbook[workbook.sheetnames[0]] to load the first sheet from Geo Demo.xlsx, this is very useful because user may changes the default sheet name.
I also declare what data is corresponding to each column, this will make our code more readable. Also, if we need to review geological data from other files, which will likely located on other columns, then we will only need to change those declarations.
Next, let's loop through rows, select the cells, review them with the review_geo function, and finally save a new excel file with reviewed data. Add the following line to geo.py:
row_start = 2    # geo data starts at row 2
row_end = 10    # geo data ends at row 10

for i in range(row_start, row_end+1):
    cell_site = worksheet[f'{col_site}{i}']
    cell_latitude = worksheet[f'{col_latitude}{i}']
    cell_longitude = worksheet[f'{col_longitude}{i}']

    reviewer_geo(cell_latitude)
    reviewer_geo(cell_longitude)

# save the updated excel
output_file_path = 'Geo Demo Reviewed.xlsx'
workbook.save(output_file_path)
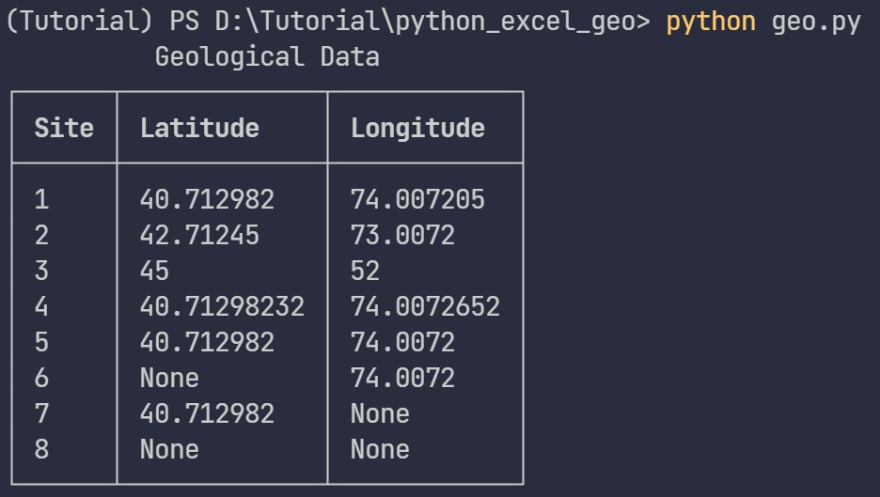
Here I use rich to print out the file's content in the main loop (it't not crucial to the program so I didn't show the code here).
Let's review the data! (reviewer.py)
After we retrieve the data from excel file, we can start to write the reviewing function.
(Note: openpyxl comes with built-in validation functions, but I usually write my own validators to fit my client's needs.)
Write comments to excel
First, I use Comments class of openpyxl to add comment to the cells that contains wrong geo data. I also use PatternFill class of openpyxl to fill the error cells with a background, it can make users identify errors more easily.
Create two functions in reviewer.py, write_comment can add red background and comment to a cell. add_green_bg simply add a green background to a cell.
from openpyxl.comments import Comment
from openpyxl.styles import PatternFill

def write_comment(cell, comment_text):
    red_bg = PatternFill(fill_type='solid',
                         start_color='FF0000',
                         end_color='FF0000')
    cell.fill = red_bg
    comment = Comment(comment_text, 'Python')
    cell.comment = comment

def add_green_bg(cell):
    green_bg = PatternFill(fill_type='solid',
                         start_color='00FF00',
                         end_color='00FF00')
    cell.fill = green_bg
Create a reviewer_geo function in reviewer.py. This function identifies which value is not desired, and then write comment or add background to the containing cell. You can read the comments in following code to see how it works.
def reviewer_geo(cell):
    val_geo = cell.value
    str_geo = str(val_geo)

    # check if cell is empty
    if val_geo is None:
        write_comment('This cell must be filled')

    # if cell is not empty, check if cell contains float
    elif isinstance(val_geo, int):
        write_comment('This cell must be a float number')

    else:
        # if cell is not empty, but contains characters other than ditits and dicimal point

        for c in str_geo:
            if not c.isdigit() and c != '.':
                write_comment('This cell must be a float number')
                return

        # if cell value is a float number, check if cell contains float with 6 decimal places
        len_geo = len(str_geo.split('.')[-1])
        if len_geo != 6:
            if len_geo > 6:
                cell.value = "{:.6f}".format(float(str_geo))    # remove extra decimal points
            else:
                write_comment('Geo data must be a float number with 6 decimal places')
                return
Result
Run the geo.py, and we have the desired result in Geo Demo Reviewed.xlxs. From my experience, with 10,000 lines of data, it could be done in few seconds!


Oldest comments (0)