You’ve finalized the development of your twitter-killer app. You heard of NoSQL databases and decided to use ScyllaDB for its sub-millisecond writes and high availability. The app looks also great! But then, you get an email from your colleague telling you there are issues with the load tests.
The above screenshot is the ScyllaDB Monitoring dashboard, more specifically from the Scylla CQL dashboard. We can clearly see red gages indicating there are a few issues in the app.
How can you further optimize your code to face millions of operations? Here are five ways to get the most out of your CQL queries.
1. Prepare your statements
We can see from the ScyllaDB CQL Dashboard that 99% of my queries during my test were non-prepared statements. To understand what this means and how it impacts performance, let’s talk about how queries are executed in ScyllaDB.
You can run a query using the execute function like so:
rows = session.execute(‘SELECT name, age, email FROM users’)
for user_row in rows:
    print user_row.name, user_row.age, user_row.email
The above query is an example of a Simple Statement. When executed, ScyllaDB will parse the query string again, without the use of a cache. This is inefficient if you run the same queries often.

If you often execute the same query, consider using Prepared Statements instead.
user_lookup_stmt = session.prepare(“SELECT * FROM users WHERE user_id=?”)
users = []
for user_id in user_ids_to_query:
 user = session.execute(user_lookup_stmt, [user_id])
 users.append(user)
When you prepare the statement, ScyllaDB will parse the query string, cache the result and return a unique identifier. When you execute the prepared statement, the driver will only send the identifier, which allows skipping the parsing phase. Additionally, you’re guaranteed your query will be executed by the node holding the data.
2. Page your queries
We can observe from the graph below that only a tiny fraction of my queries are non-paged. However, if we consider the fact that every query triggers the scan of an entire table and that the client might not need the entire data, we can understand how this is not efficient.
ScyllaDB Dashboard Non-Paged CQL Reads
This one might sound obvious. If your users query an entire table on a consistent basis, paging could improve latency tremendously. To do so, you can add the fetch_size argument to the statement.
query = "SELECT * FROM users"
statement = SimpleStatement(query, fetch_size=10)
for user_row in session.execute(statement):
    process_user(user_row)
3. Avoid Allow filtering
The below query selects all users with a particular name.
query = "SELECT * FROM users WHERE name=%s ALLOW FILTERING"
Let’s see what the above does in more detail.
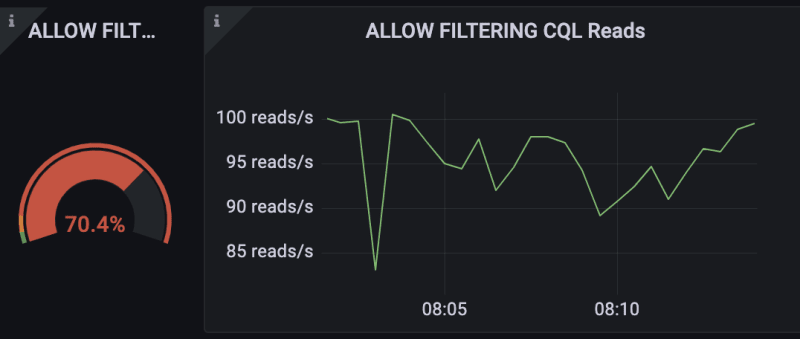
From the dashboard, we can see that we only have about 100 reads per second, which in theory can be considered negligible.
However, the query triggers a scan of the entire table. This means that the query reads the entire users’ table just to return a few, which is inefficient.

Because of the way ScyllaDB is designed, it’s far more efficient to use an index for lookups. Thus, your query will always find the node holding the data without scanning the entire table.
query = "SELECT * FROM users WHERE id=%s"
If you feel that is not enough, you might consider revisiting your schema.
4. Bypass cache
For low latency purposes, ScyllaDB looks for the result of your query in the cache first. In case the data is not present in the cache, the database will read from the disk. We use BYPASS CACHE to avoid unnecessary lookups in the cache and get the data straight from the disk.

ScyllaDB CQL Dashboard Range Scans without BYPASS CACHE
You can use BYPASS CACHE for rare range scans to inform the database that the data is unlikely to be in memory and need to be fetched directly from the disk instead. This will avoid an unnecessary lookup in the cache.
SELECT * FROM users BYPASS CACHE;
SELECT name, occupation FROM users WHERE userid IN (199, 200, 207) BYPASS CACHE;
SELECT * FROM users WHERE birth_year = 1981 AND country = 'US' ALLOW FILTERING BYPASS CACHE;
5. Use CL=QUORUM
CL stands for Consistency Level. To better understand what it is, let’s review the journey of an INSERT query.
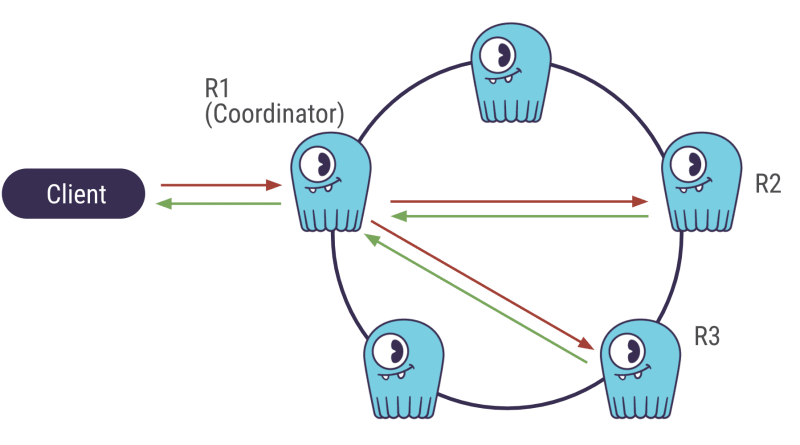
ScyllaDB is a distributed database. The cluster is formed by a group of nodes (or machines) that communicate with each other. When the client sends an insert query, it is first sent to a random node (the coordinator) that will pass the data to other nodes to save copies of it. The number of nodes the data is copied to is called the Replication Factor.

QUORUM it’s provides better availability than ONE and better latency than ALL.
While the client awaits the database’s response, the coordinator also needs a response from the nodes replicating the data. The number of nodes the coordinator waits for is called the Consistency Level.
Let’s now get back to QUORUM. QUORUM means that the coordinator requires the majority of the nodes to send a response before it sends itself a response to the client. The majority is (Replication Factor / 2 )+ 1 . In the above case, it would 2.
Why should you use QUORUM? Because it provides better availability than ONE and better latency than ALL.
With CL=ONE, the coordinator sends a response to the client as fast as it inserts the data, without waiting for other nodes. In the case that the nodes are down, the data is not replicated and therefore not highly available.
With CL=ALL, the coordinator needs a response of all nodes in order to respond to the client, which increases latency.
Conclusion
An app that performs well in development might face more issues in production. The ScyllaDB Monitoring Dashboard describes the health of your cluster’s nodes and gives you a good indication of the quality of your CQL queries and how they perform at scale. Consider using it at an early stage, for development or testing, to capture potential issues in your code and fix them before they ever get to your users.
Thanks!


Top comments (0)