Authored by Haneesh Reddy Poddutoori
We live in a world where diverse systems—social networks, monitoring, stock exchanges, websites, IoT devices—all continuously generate volumes of data in the form of events. One can perform a wide variety of analyses, like aggregations, filtering, or sampling, on these event streams, either at the record level or over sliding time windows. In this blog, I will show how Rockset can serve a live dashboard, which surfaces analytics on real-time Twitter data ingested into Rockset from an Amazon Kinesis stream.
Setting up a Kinesis Stream
The Python code snippet below shows how to create a Kinesis stream programmatically. This can also be achieved through the AWS Console or the AWS CLI.
Writing Tweets to Kinesis
Here, I will be using the Tweepy module to fetch tweets through a streaming search API. This API allows me to specify a list of terms that I want to include in my search (e.g. “music”, “facebook”, “apple”). You need to have a Twitter developer account in order to get access to the Twitter Streaming API. Here, I have a StreamListener, which is registered to be notified on a tweet arrival. Upon receiving a tweet, it writes the tweet data to one of the 5 random shards of the Kinesis stream.
Connecting Kinesis to Rockset
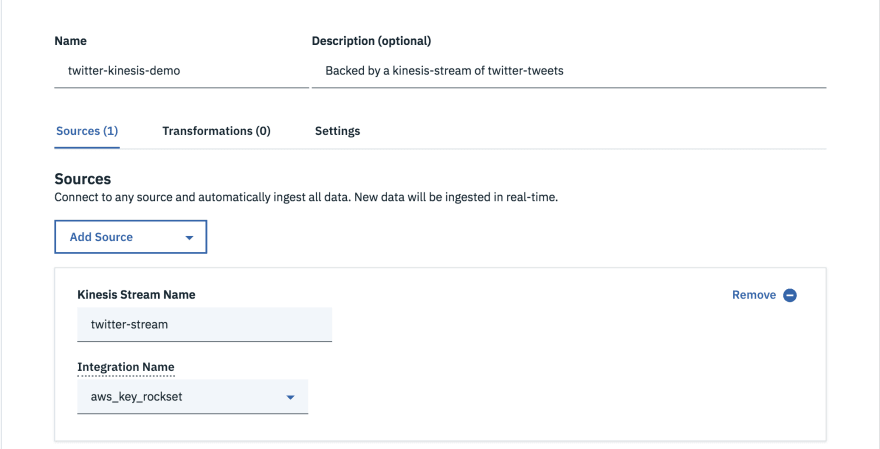
The following snippet shows how to create a collection in Rockset, backed by a Kinesis stream. Note: You need to create an Integration (an object that represents your AWS credentials) and set up relevant permissions on the Kinesis stream, which allows Rockset to perform certain read operations on that stream.
Alternatively, collections can also be created from the Rockset console, as shown below.
Building the Live Dashboard
Now that I have a producer writing tweets to a Kinesis stream and a collection to ingest them into Rockset, I can build a dashboard on top of this collection. My dashboard has two views.
Tweets View
The first view displays analytics on all the tweets coming into Rockset and has 3 panels, each of which makes its own query to Rockset.
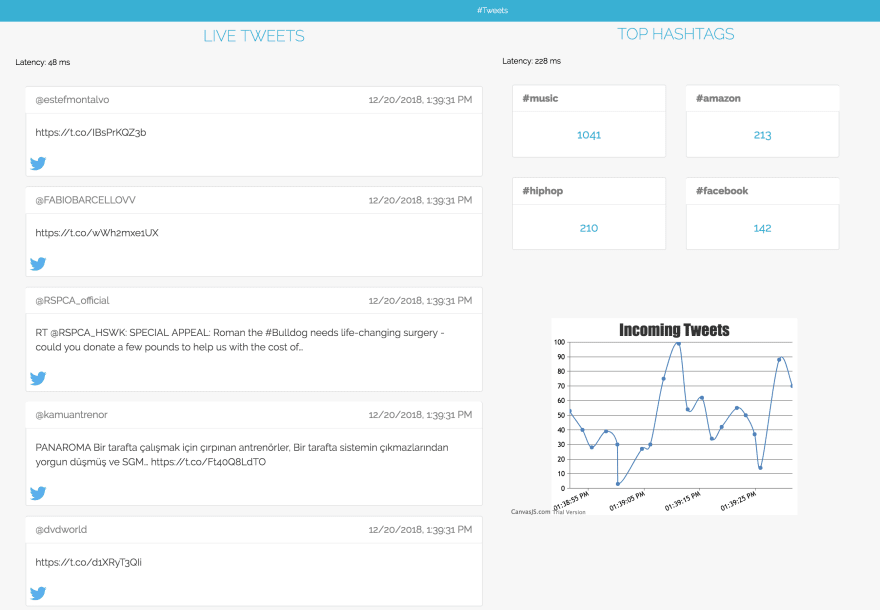
Live Tweets
The Live Tweets panel constantly refreshes to show the latest tweets appearing in the collection. A query is made at a fixed refresh interval to fetch tweets that were tweeted in the last minute. Here, I am selecting required fields to show on the feed and filtering out tweets older than a minute.
Top Hashtags
The Top Hashtags panel shows trending hashtags, which were found in most number of tweets in the last hour, along with the associated tweet count. In this query, all hashtags appearing in the last one hour are filtered into a temporary relation latest_hashtags. Using a WITH clause, latest_hashtags is used it the main query, where we group by all the hashtags and order by tweet_count to obtain the trending hashtags.
Incoming Tweets
The last panel is a chart which shows the rate at which users are tweeting. We obtain data points for the number of incoming tweets every 2 seconds and plot them in a chart.
Hashtags View
The second view displays analytics on tweets with a specific hashtag and also has 3 panels: Live Tweets, Related Hashtags, and Influencers. Each panel in the dashboard makes a query to Rockset. This is very similar to the first dashboard view but narrows the analytics to a selected hashtag of interest.
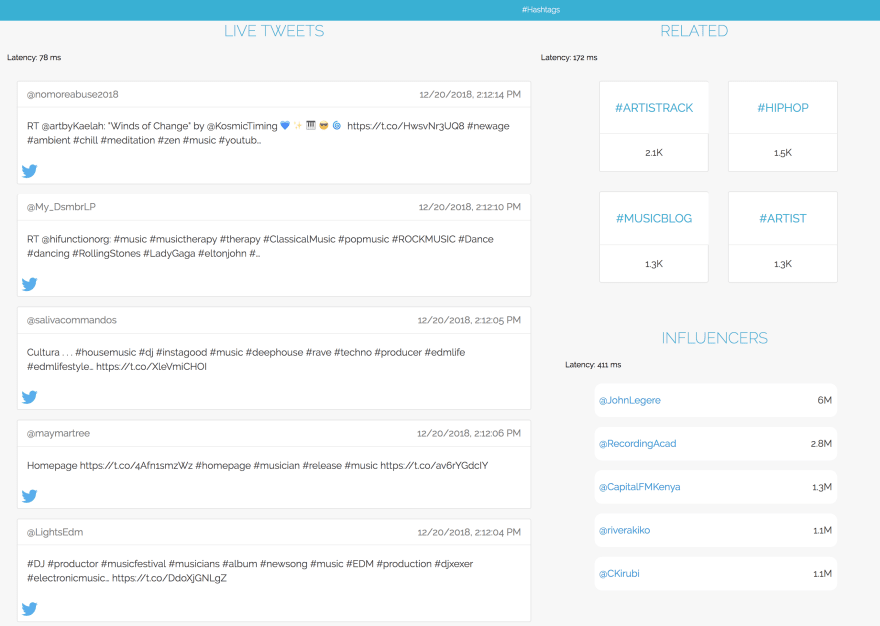
Influencers
As we have narrowed our analysis to a single hashtag, it would be interesting to see who the most influential users are around this topic. For this, we define influencers as users with the highest number of followers who are tweeting the hashtag of interest.
Related Hashtags
This section is somewhat similar to the Top Hashtags panel we saw in the Tweets view of the dashboard. It shows the hashtags that co-occur most often along with our hashtag of interest.
Live Tweets
The Live Tweets panel is very similar to one we saw in the Tweets view of the dashboard. The only difference is a new filter is applied in order to select those tweets which contain our hashtag of interest. I already used this filter for the other two panels in the Hashtags view.
Where to Go from Here
While I created this simple dashboard to illustrate how live analytics could be performed on data from Kinesis streams, Rockset supports millisecond-latency SQL that powers more complex, responsive dashboards as well.
You can refer to the full source code for this example here, if you are interested in building on streaming data using Rockset and Kinesis. Happy building!

Top comments (0)