DEV Community

Shawn Adams for Rockset

Posted on • Originally published at rockset.com on

Using Tableau for Live Dashboards on Event Data

Authored by Haneesh Reddy Poddutoori

Live dashboards can help organizations make sense of their event data and understand what's happening in their businesses in real time. Marketing managers constantly want to know how many signups there were in the last hour, day, or week. Product managers are always looking to understand which product features are working well and most heavily utilized. In many situations, it is important to be able to take immediate action based on real-time event data, as in the case of limited-time sales in e-commerce or managing contact center service levels. With the realization of the value businesses can extract from real-time data, many organizations that have standardized on Tableau for BI are seeking to implement live Tableau dashboards on their event streams as well.

Getting Started

In this blog, I will step through implementing a live dashboard on event data using Tableau. The events we will track will be recent changes to various Wikimedia projects, including Wikipedia.

wikimedia-edits

For this project, we will need:

Ingesting Data from Wikimedia Event Stream

I will first create a collection, to which we will write the events originating from the Wikimedia stream.

rockset-create-collection

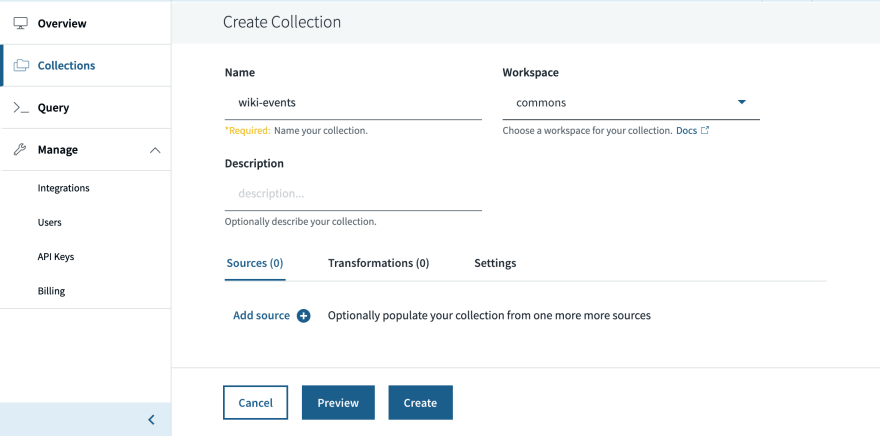
Once we have the collection set up in Rockset, I can run a script that subscribes to events from the Wikimedia stream and writes them to the wiki-events collection in Rockset.

import json
from sseclient import SSEClient as EventSource
from rockset import Client
rs=Client(api_key=ROCKSET_API_KEY)
events = rs.Collection.retrieve("wiki-events")
streams = 'recentchange,page-links-change,page-create,page-move,page-properties-change,page-delete,test,recentchange,revision-create,page-undelete'
url = 'https://stream.wikimedia.org/v2/stream/{}'.format(streams)
for event in EventSource(url):
try:
if event.event == 'message':
change = json.loads(event.data)
events.add_docs([change])
except:
continue
view raw write_events.py hosted with ❤ by GitHub

While we are using Rockset's Write API to ingest the Wikimedia event stream in this case, Rockset can also sync data from other sources, like Amazon DynamoDB, Amazon Kinesis, and Apache Kakfa, to power live dashboards, if required.

Now that we are ingesting the event stream, the collection is growing steadily every second. Describing the collection shows us the shape of data. The result is quite long, so I will just show an abbreviated version below to give you a sense of what the JSON data looks like, along with some of the fields we will be exploring in Tableau. The data is somewhat complex, containing sparse fields and nested objects and arrays.

rockset> DESCRIBE wiki-events;
+--------------------------------------------------------+---------------+---------+-----------+
| field | occurrences | total | type |
|--------------------------------------------------------+---------------+---------+-----------|
| ['$schema'] | 12172 | 2619723 | string |
| ['_event_time'] | 2619723 | 2619723 | timestamp |
| ['_id'] | 2619723 | 2619723 | string |
| ['added_links'] | 442942 | 2619723 | array |
| ['added_links', '*'] | 3375505 | 3375505 | object |
| ['added_links', '*', 'external'] | 3375505 | 3375505 | bool |
| ['added_links', '*', 'link'] | 3375505 | 3375505 | string |
...
| ['bot'] | 1040316 | 2619723 | bool |
| ['comment'] | 1729328 | 2619723 | string |
| ['database'] | 1561437 | 2619723 | string |
| ['id'] | 1005932 | 2619723 | int |
| ['length'] | 679149 | 2619723 | object |
| ['length', 'new'] | 679149 | 679149 | int |
| ['length', 'old'] | 636124 | 679149 | int |
...
| ['removed_links'] | 312950 | 2619723 | array |
| ['removed_links', '*'] | 2225975 | 2225975 | object |
| ['removed_links', '*', 'external'] | 2225975 | 2225975 | bool |
| ['removed_links', '*', 'link'] | 2225975 | 2225975 | string |
...
| ['timestamp'] | 1040316 | 2619723 | int |
| ['title'] | 1040316 | 2619723 | string |
| ['type'] | 1040316 | 2619723 | string |
| ['user'] | 1040316 | 2619723 | string |
| ['wiki'] | 1040316 | 2619723 | string |
+--------------------------------------------------------+---------------+---------+-----------+
view raw describe.sql hosted with ❤ by GitHub

Connecting a Tableau Dashboard to Real-Time Event Data

Let us jump into building the dashboard. I'll first need to connect to Rockset, as a new data source, from my Tableau Desktop application. Follow the steps here to set this up.

We can create a first chart showing the number of changes made by bots vs. non-bots for every minute in the last one hour. I can use a custom SQL query within Tableau to specify the query for this, which gives us the resulting chart.

select
bot as is_bot,
format_iso8601(timestamp_seconds(60 * (timestamp / 60))) as tb_time
from
"wiki-events" c
where
timestamp is not null
and bot is not null
view raw bot.sql hosted with ❤ by GitHub

tableau-live-dashboard-1

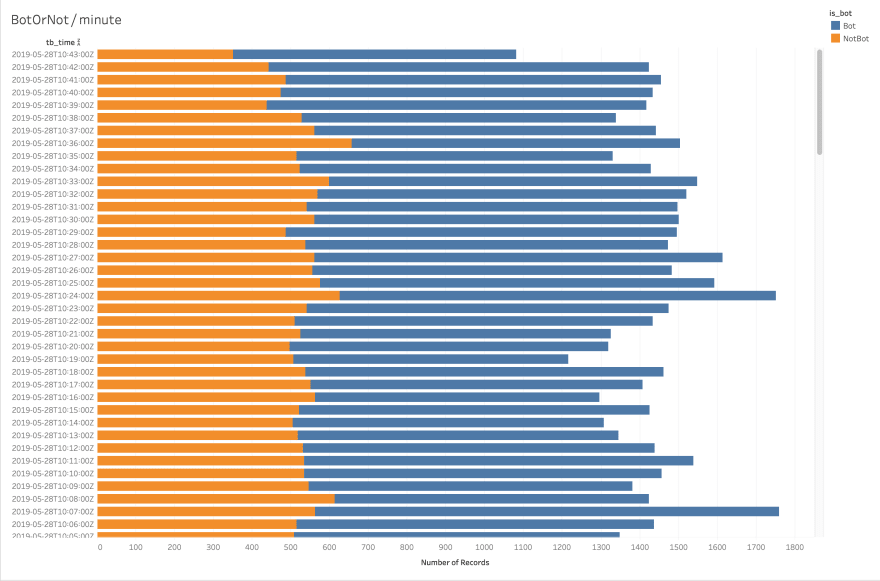
That's about 1,400 events per minute, with bots responsible for the majority of them.

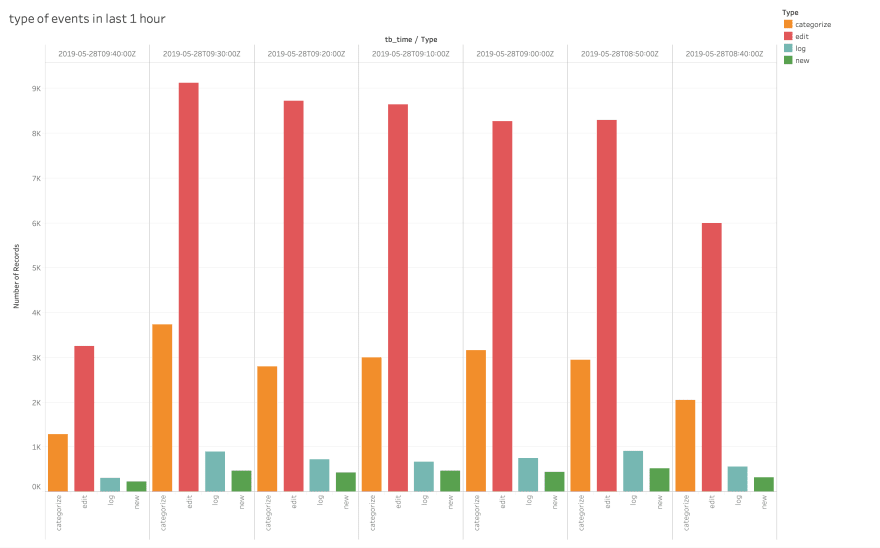
Wikimedia also tracks several types of change events: edit, new, log, and categorize. We can get an up-to-date view of the various types of changes made, at 10-minute intervals, for the last hour.

select
type,
format_iso8601(timestamp_seconds(600 * (timestamp / 600))) as tb_time
from
"wiki-events"
where
timestamp_seconds(timestamp) > current_timestamp() - hours(1)
view raw events.sql hosted with ❤ by GitHub

tableau-live-dashboard-2

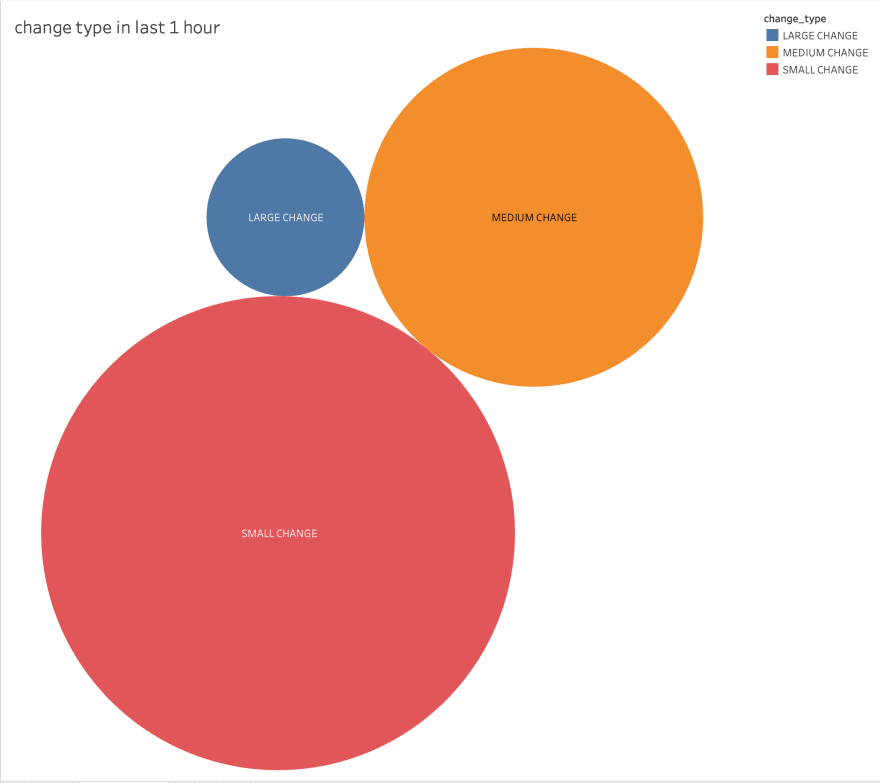
Finally, I plotted a chart to visualize the magnitude of the edits made within the last hour, whether they were small-, medium-, or large-scale edits.

select
CASE
WHEN
sq.change_in_length <= 100
THEN
'SMALL CHANGE'
WHEN
sq.change_in_length <= 1000
THEN
'MEDIUM CHANGE'
ELSE
'LARGE CHANGE'
END
as change_type
from
(
select
abs(c.length.new - c.length.old) as change_in_length
from
"wiki-events" c
where
c.type = 'edit'
and timestamp_seconds(c.timestamp) > current_timestamp() - hours(1)
)
sq
view raw size.sql hosted with ❤ by GitHub

tableau-live-dashboard-3

Recap

In a few steps, we ingested a stream of complex JSON event data, connected Tableau to the data in Rockset, and added some charts to our live dashboard. While it may normally take tens of minutes, if not longer, to process raw event data for use with a dashboarding tool, using Tableau on real-time data in Rockset allows users to perform live analysis on their data within seconds of the events occurring.

If you wish to adapt what we've done here to your use case, the source code for this exercise is available here.

AWS Security LIVE!

Tune in for AWS Security LIVE!

Join AWS Security LIVE! for expert insights and actionable tips to protect your organization and keep security teams prepared.

Learn More

Top comments (0)

A Workflow Copilot. Tailored to You.

Pieces.app image

Our desktop app, with its intelligent copilot, streamlines coding by generating snippets, extracting code from screenshots, and accelerating problem-solving.

Read the docs

👋 Kindness is contagious

Immerse yourself in a wealth of knowledge with this piece, supported by the inclusive DEV Community—every developer, no matter where they are in their journey, is invited to contribute to our collective wisdom.

A simple “thank you” goes a long way—express your gratitude below in the comments!

Gathering insights enriches our journey on DEV and fortifies our community ties. Did you find this article valuable? Taking a moment to thank the author can have a significant impact.

Okay