Often, the basic setup for Redux DevTools Extension is not enough. I ran into this problem while trying to debug a redux store in my chrome extension. Here are the steps I followed to address this problem:
Step 1: Follow instructions from here to install the Redux Dev Tools chrome extension.
npm install -- save-dev remote-redux-devtools
or
yarn add remote-redux-devtools --dev
Step 2: Assuming a basic store set up without any sort of middlewares, configure your project to use it.
import { createStore } from 'redux';
import devToolsEnhancer from 'remote-redux-devtools';

import rootReducer from './reducers';

const store = createStore(rootReducer, devToolsEnhancer());

export default store;
Now we’re ready to debug.
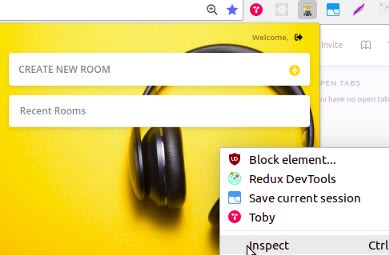
Open extension popup by clicking on its icon. Right-click on the opened extension window and choose Inspect. This will open Chrome Developers Tools and will keep your extension window open until you close the devtools.
Right-click on the extension window again and choose Open Remote DevTools under Redux DevTools.

This will open Remote Dev Tools that will connect to your Redux store in a moment.

Now you’re ready to debug 😊👏.

Top comments (0)