In the previous installment we recognized the tools that we can use to validate our code and its coverage.
Today, we are going to focus on the operation of the tools that Visual Studio provides us.

Fundamental
Visual Studio version
To take advantage of this proposal, you must have Visual Studio in its Enterprise version, which is paid.
Project with Unit Tests
It is worth clarifying that, to follow these steps, the project must have unit tests. Otherwise, I will tell you briefly as below.
Create a Unit Test Project
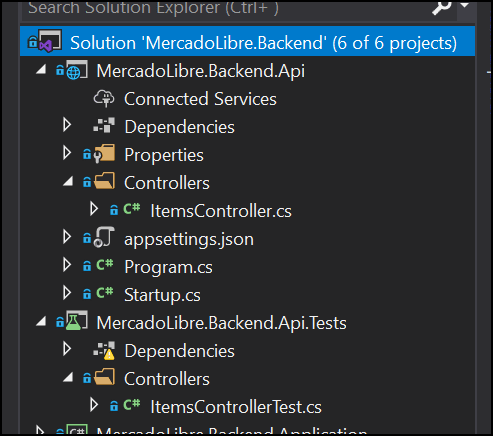
We right-click on the solution, and go to Add > New Project.

It can also be MSTest or NUnit, which runs at your choice. You may also need to install additional extensions.

Just as we create projects for libraries or the API itself, we also have to create one for testing.
Create a Test Class
Following the same structure of the project to be tested, we create a mirror class (the same name, although with the suffix _ "Test"_).
It is essential that you follow a structure that allows you to recognize your test scheme, to guarantee the scalability of your project.
To do this, we right-click on the folder in question and go to Add > New item and within it, we select "Class".
Creating a Unit Test
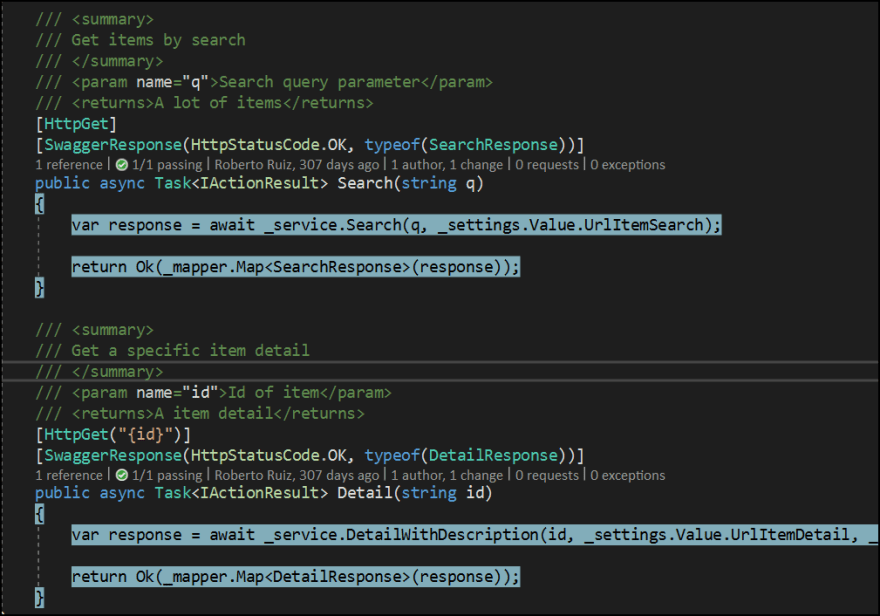
Inside the created class, we configure its setup and then, the test itself.

The example is in NUnit, although from there we can understand that it is good to work with the "AAA" pattern and that the differences between NUnit and xUnit are minimal.
Ok, let's do it!
Using the Test Explorer
The Test Explorer, as a tool, allows us to run tests of several projects and the Test Class that correspond to it, under various testing frameworks.
Now, to run our tests, we have to land on our unit tests project, and we click Run Tests.

Whether or not you have compiled the solution, the solution will be pre-compiled anyway.
Then, you will have a new window, called Test Explorer, in which the tests will be run.

To consider
- In the left area, you will see the structure of the test project and the result of each one.
- On the right, you will see the details in case you had a different result than expected.
- At the top, shortcuts to quick functionalities and filters according to the result of each test.
Analyzing Coverage
Since we ran the tests under the Test Explorer, now we can get excited with this tool, which seeks to give us feedback on the coverage of our code.
When we develop unit tests, we must validate that they test all flows. Only in this way is our code completely covered.
With the solution open, let's go to Test > Analyze Code Coverage for All Tests

At each opportunity, the solution will be compiled and the tests run, even if you have already done it previously.
The first time will take longer than usual to get the necessary dependencies.
A new window appears: Code Coverage Results.

We agree that the visualization is a bit rustic, although it can be understood (in order from higher to lower) as:
-
.coveragexmlfile generated with the coverage report. - Every project that we have in the solution (where we see extensions
* .dll). - Each namespace is registered within each project.
- Each unit test created
- The reference to the method it covers.
On the right, we see numbers, according to blocks or percentage of code covered (according to our preference).
Exporting to an XML file
Using the button below ("Export Results"), you can export it to a .coveragexml file.

Its structure is analogous to that of a common XML file, and it can be read programmatically as well as on another machine with Visual Studio installed.
Visualizing Coverage in Code
When we say that the coverage is intended to give us feedback on the scope of our tests, this is where we can take it to reality.
Simply, we should click on the following button:

To be able to reflect it in our code, with a color according to the status of your coverage.
We can agree that they are not the most representative colors, but not to complain because we can configure the colors to our liking.
To do this, we go to Tools > Options > Environment > Fonts and Colors. Within the window that opens, in "Show settings for", we select Text Editor.

Within the same window, in Display Items you will see a long list of options. We are only interested in those that begin with "Coverage...":
- Coverage Not Touched Area
- Coverage Partially Touched Area
- Coverage Touched Area
That's it!
In the next installment, we are going to see this, although with Open Source tools.
(Versión en español en Medium)

Top comments (0)