
3 eager Vodafone developers and I joined Google at their Kings Cross Campus to take part in a Mobile Web Hackathon 🛠.
The day consisted of how to improve the performance of your mobile web applications to present as quickly as possible content to your users.
Why does it matter? 🤷
Today consumers expect to have everything accessible to them and that access available at relative speed. At Vodafone, we aim to create web applications that run fast enough so that our customers without a top tier device or solid connection can still enjoy our applications without seeing a dreaded loading spinner.
Time to get organised 🗄️
The team we brought along to hack consisted of developers who all worked in different areas of Vodafone’s web portfolio, so we had to get organised:
To start, we split our developers into two groups to be more agile and focused on common solutions to improve the performance of our project, we looked at:
Preparing the development environment so we could test each solution faster and see if it had a performance impact.
We used our
pay-as-you-gorepository because it has a clean structure and was easier to approach for all our developers.We tried not to get too distracted by the amazingly good looking food they brought. (Probably the hardest thing we had to do!) 🍕
Once we got this in place we started working on the solutions.
What are thooooose!? 👟
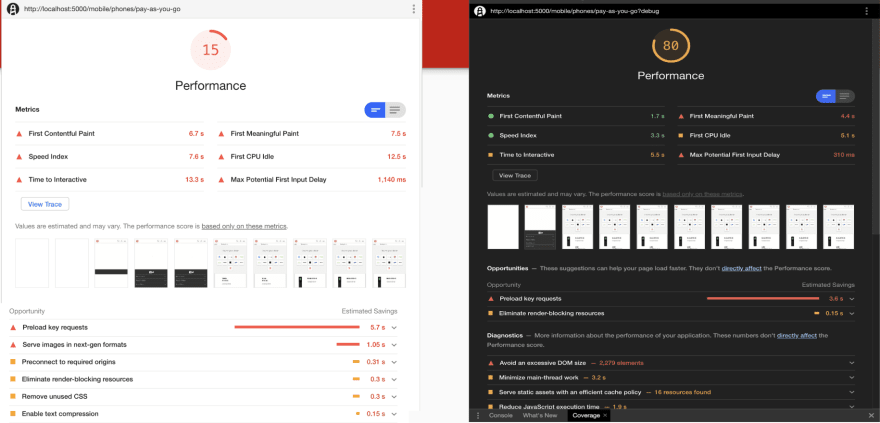
These are the initial and final metrics after applying all the performance solutions. Among them are:
Preload fonts + convert WOFF to WOFF2 🐶 (woof?)
We preloaded the fonts and changed the format of our fonts to WOFF2 which offers a 30% average compression gain over the original WOFF, but is not supported on IE 11. That being said, for that particular case we need to fallback to WOFF.
Image optimisation + next-gen formats 🖼️
We changed all the PNG images to the WEBP format which offers 26% smaller file sizes. Also, we applied some lazy load instead of load all of them at once. We only needed to load the first 6 images that appear on screen in order to achieve faster times. The rest could be lazy loaded.
Brotli compression 🥦
We used Brotli to compress the files:
Javascript files compressed with Brotli are 14% smaller than gzip.
HTML files are 21% smaller than gzip.
CSS files are 17% smaller than gzip
For the browsers that don’t support Brotli compression we fallback to gzip which is still better than no compression at all.
Bundle splitting 🖖
Before we were loading all the files at once in one big fat bundle so we split the bundle by route level. This gave us quite a big score bump in the lighthouse metrics.
In the future, it would be great to go deeper into the component level and load them with dynamic imports.
Async loading analytics 👨🏫
Still with all those changes above we were not getting the results we wanted, and you could tell, after profiling the page, that analytics were the bottleneck.
Our application is waiting until the analytics were loaded giving us a very low TTI (time to interact).
We changed that by loading the analytics asynchronously. This might be controversial as there’s no way to guarantee 100% that the first events will be fired but when we tried, they were indeed being fired as it they were being loaded in async mode which is faster than defer, so we decided to go with it.
After doing that, we observed another big bump in the lighthouse metrics.
Next Steps
And just like that, we went from 15% to 80% lighthouse score but… there is still room for improvement!
1️⃣ We would like to set a performance budget and compare current and previous score on Pull Request.
2️⃣ Techniques like tree-shaking could be nice to apply to attempt to not load all of the libraries in one go.
3️⃣ We want to try to inline the critical CSS and JS, improve the cache control as well as compress the SVGs.
4️⃣ Last one would be to take a look at the unused code. We could observe in the google dev tools that more that 90% of our JS and CSS code was unused. That’s a lot! But might be related to number 2.
We are also going to look at our other journeys to see if we can leverage what we learned to improve our customers experience online with faster load times!


Top comments (0)