O(log n) makes continuous profiling possible
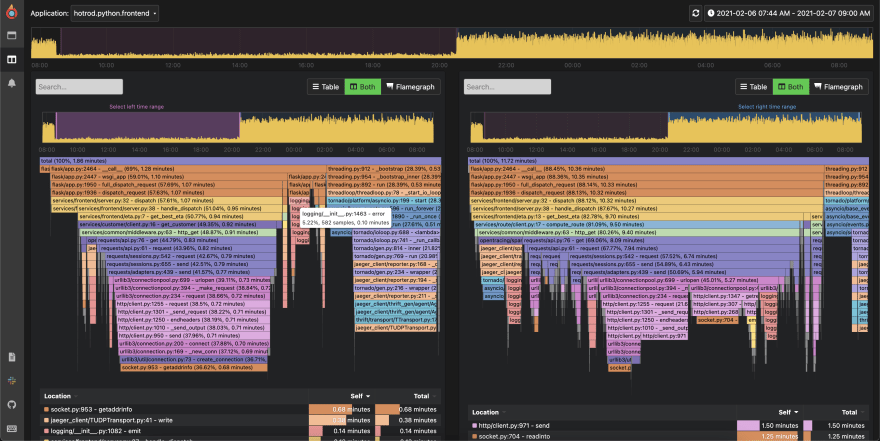
Pyroscope is software that lets you continuously profile your code to debug performance issues down to a line of code. With just a few lines of code it will do the following:
Pyroscope Agent
- Polls the stack trace every 0.01 seconds to see which functions are consuming resources
- Batches that data into 10s blocks and sends it to Pyroscope server
Pyroscope Server
- Receives data from the Pyroscope agent and processes it to be stored efficiently
- Pre-aggregates profiling data for fast querying when data needs to be retrieved
Storage Efficiency
The challenge with continuous profiling is that if you just take frequent chunks of profiling data, compress it, and store it somewhere, it becomes:
- Too much data to store efficiently
- Too much data to query quickly
We solve these problems by:
- Using a combination of tries and trees to compress data efficiently
- Using segment trees to return queries for any timespan of data in O(log n) vs O(n) time complexity
Step 1: Turning the profiling data into a tree
The simplest way to represent profiling data is in a list of string each one representing a stack trace and a number of times this particular stack trace was seen during a profiling session:
server.py;fast_function;work 2
server.py;slow_function;work 8
The first obvious thing we do is we turn this data into a tree. Conviniently, this represenation also makes it easy to later generate flamegraphs.
Compressing the stack traces into trees saves space on repeated elements. By using trees, we go from having to store common paths like net/http.request in the db multiple times to only having to store it 1 time and saving a reference to the location at which it's located. This is fairly standard with profiling libraries since its the lowest hanging fruit when it comes to optimizing storage with profiling data.
Step 2: Adding tries to store individual symbols more efficiently
So now that we've compressed the raw profiling data by converting into a tree, many of the nodes in this compressed tree contain symbols that also share repeated elements with other nodes. For example:
net/http.request;net/io.read 100 samples
net/http.request;net/io.write 200 samples
While the net/http.request, net/io.read, and net/io.write functions differ they share the same common ancestor of net/.
Each of these lines can be serialized using a prefix tree as follows. This means that instead of storing the same prefixes multiple times, we can now just store them once in a trie and access them by storing a pointer to their position in memory:

In this basic example we save ~80% of space going from 39 bytes to 8 bytes. Typically symbol names are much longer and as the number of symols grows, storage requirements grow logarithmically rather than linearly.
Step 1 + 2: Combining the trees with the tries
In the end, by using a tree to compress the raw profiling data and then using tries to compress the symbols we get the following storage amounts for our simple example:
| data type           | bytes |
|---------------------|-------|
| raw data            | 93    |
| tree                | 58    |
| tree + trie         | 10    |
As you can see this is a 9x improvement for a fairly trivial case. In real world scenarios the compression factor gets much larger.
Step 3: Optimizing for fast reads using Segment Trees
Now that we have a way of storing the data efficiently the next problem that arises is how do we query it efficiently. The way we solve this problem is by pre-aggregating the profiling data and storing it in a special segment tree.
Every 10s Pyroscope agent sends a chunk of profiling data to the server whuch writes the data into the db with the corresponding timestamp. You'll notice that each write happens once, but is replicated multiple times.
Each layer represents a time block of larger units so in this case for every two 10s time blocks, one 20s time block is created. This is to make reading the data more efficient (more on that in a second).
Turn reads from O(n) to O(log n)
If you don't use segment trees and just write data in 10 second chunks the time complexity for the reads becomes a function of how many 10s units the query asks for. If you want 1 year of data, you'll have to then merge 3,154,000 trees representing the profiling data. By using segment trees you can effictevely decrease the amount of merge operations from O(n) to O(log n).
Help us add more profilers
We spent a lot of time on solving this storage / querying problem because we wanted to make software that can do truly continuous profiling in production without causing too much overhead.
While Pyroscope currently supports 4 languages, we would love to add more.
Any sampling profiler that can export data in the "raw" format linked above can become a Profiling agent with Pyroscope. We'd love your help building out profilers for other languages!
If you want to help contribute or need help setting up Pyroscope heres how you can reach us:

Top comments (0)