※This is an English translation of my original article in Japanese.
Snowflake has introduced a new feature that allows you to execute specified condition expressions and trigger alerts when new records are added to a target table. (As of March 23, 2025, this is a preview feature.)
https://docs.snowflake.com/en/release-notes/2025/other/2025-03-19-alerts-on-new-data
https://docs.snowflake.com/en/user-guide/alerts#creating-an-alert-on-new-data
I've used this feature to set up error notifications for tasks and Dynamic Tables, and I'd like to share my implementation.
Setting Up the Event Table
Preliminary Setup: Creating Test Database, Schema, and Tables
First, let's create a database, schema, and table for testing:
-- Create databases for each layer
use role sysadmin;
create or replace database raw_db;
create or replace database stg_db;
create or replace database mart_db;

-- Create schemas for each layer
use role sysadmin;
create or replace schema raw_db.sales;
create or replace schema stg_db.sales;
create or replace schema mart_db.sales;

-- Create a sample table in the raw layer
use role sysadmin;
create or replace table raw_db.sales.orders (
    order_id varchar(50),
    customer_id varchar(50),
    order_date timestamp_ntz,
    product_id varchar(50),
    quantity integer,
    price decimal(18,2),
    load_timestamp timestamp_ntz default current_timestamp()
);

insert into raw_db.sales.orders (order_id, customer_id, order_date, product_id, quantity, price)
values
 ('ord-001', 'cust-100', current_timestamp(), 'prod-a', 5, 19.99);
Creating the Event Table
Next, let's create an event table:
-- Create event table
use role sysadmin;
create or replace database event_db;
create or replace schema event_db.sales_dept;
create or replace event table event_db.sales_dept.datapipeline_events;
Associating the Event Table with Databases
Now, let's associate the created event table with each database:
When associating an event table, please note:
- This association requires the
ACCOUNTADMINrole (as of March 23, 2025, there doesn't seem to be a corresponding account-level privilege) - The event table and the target table can be in different databases/schemas
- One event table can be associated with multiple databases/schemas
The following blog post might also be helpful:
https://dev.classmethod.jp/articles/associate--event-table-with-database-snowflakedb/
Let's execute the following query to associate the event table with each database:
-- Associate each database with event_db.sales_dept.datapipeline_events
use role accountadmin;
alter database raw_db set event_table = event_db.sales_dept.datapipeline_events;
show parameters like 'event_table' in database raw_db;
alter database stg_db set event_table = event_db.sales_dept.datapipeline_events;
show parameters like 'event_table' in database stg_db;
alter database mart_db set event_table = event_db.sales_dept.datapipeline_events;
show parameters like 'event_table' in database mart_db;
Setting Log Level at Schema Level
Just associating the event table doesn't collect logs, so we need to set the Log Level at the schema level:
Note that setting the Log Level requires the account-level modify log level privilege:
-- Grant log level modification privilege to sysadmin (be careful with this in production)
use role accountadmin;
grant modify log level on account to role sysadmin;

-- Set Log Level at schema level
use role sysadmin;
alter schema raw_db.sales set log_level = error;
show parameters like '%log_level%' in schema raw_db.sales;
alter schema stg_db.sales set log_level = error;
show parameters like '%log_level%' in schema stg_db.sales;
alter schema mart_db.sales set log_level = error;
show parameters like '%log_level%' in schema mart_db.sales;
Enable Change Tracking on the Event Table
Next, let's enable Change Tracking on the event table:
https://docs.snowflake.com/en/user-guide/streams-manage#label-enabling-change-tracking-views
-- Enable Change Tracking on the event table
alter table event_db.sales_dept.datapipeline_events set change_tracking = true;
Verify That Logs Are Being Collected
Now, let's execute the following queries to define tasks and Dynamic Tables that will generate errors (the Dynamic Table queries will fail as expected, but they will generate error logs for our testing purposes):
-- Create a task in the raw layer that will error out
create or replace task raw_db.sales.error_orders_task
    warehouse = compute_wh
    schedule = 'using cron 0 */1 * * * utc'
as
-- Query that will generate an error (clearly insufficient number of columns)
insert into raw_db.sales.orders (order_id, customer_id, order_date, product_id, quantity, price)
select
    'ord-' || to_varchar(uniform(1000, 9999, random()));

-- Enable and manually execute the task
alter task raw_db.sales.error_orders_task resume;
execute task raw_db.sales.error_orders_task;

-- Create a Dynamic Table in the stg layer that will error out (data type error)
create or replace dynamic table stg_db.sales.error_orders
target_lag = '1 minute'
warehouse = compute_wh
as
select
    order_id,
    customer_id,
    -- Intentionally cause a data type error (converting string to date)
    'not-a-valid-date'::date as order_date,
    product_id,
    quantity,
    price,
    price * quantity as total_amount,
    current_timestamp() as processed_timestamp
from raw_db.sales.orders;

-- Create a Dynamic Table in the mart layer that will error out (division by zero)
create or replace dynamic table mart_db.sales.error_sales_summary
target_lag = '5 minutes'
warehouse = compute_wh
as
select
    product_id,
    sum(quantity) as total_quantity,
    sum(price) as total_price,
    -- Intentionally cause a division by zero error
    sum(price) / (sum(quantity) - sum(quantity)) as avg_price -- Division by zero
from raw_db.sales.orders
group by product_id;
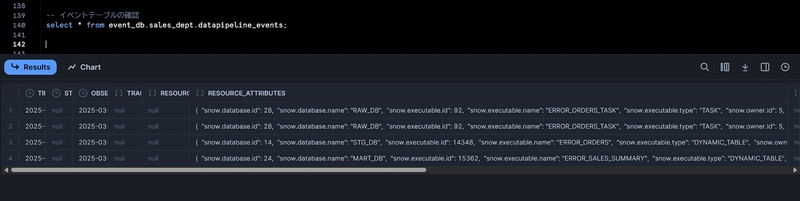
After waiting about a minute, execute the following query to check that error logs have been collected:
-- Check the event table
select * from event_db.sales_dept.datapipeline_events;
Setting Up the Alert
Preliminary Setup: Creating an Email Notification Integration
Since we want to send email notifications when the alert condition is met, let's create an Email Notification Integration:
-- Create Email Notification Integration
use role accountadmin;
create or replace notification integration email_int
  type = email
  enabled = true;
grant usage on integration email_int to role sysadmin;
Setting Up the Alert
Execute the following query to set up the alert:
Since we're not specifying a warehouse parameter, this will be a serverless alert:
create or replace alert event_db.sales_dept.datapipeline_error_alert
  if (exists(
    select * from event_db.sales_dept.datapipeline_events
    where
      record:severity_text = 'ERROR' and
      record_type = 'EVENT' and
      value:state = 'FAILED'
  ))
  then
    begin
      let error_details varchar;

      select array_to_string(array_agg(error_info), chr(10) || chr(10)) into :error_details
      from (
        select
          'Error in ' || resource_attributes:"snow.executable.type" || ': ' ||
          resource_attributes:"snow.executable.name" ||
          chr(10) || 'Database: ' || resource_attributes:"snow.database.name" ||
          chr(10) || 'Schema: ' || resource_attributes:"snow.schema.name" ||
          chr(10) || 'Error Message: ' || value:"message" ||
          chr(10) || 'State: ' || value:"state" ||
          chr(10) || 'Timestamp: ' || timestamp as error_info
        from table(result_scan(snowflake.alert.get_condition_query_uuid()))
        order by timestamp desc
        limit 10
      );

      call system$send_email(
        'email_int',
        'aaa@example.jp',
        'Data Pipeline Error Alert',
        'The following errors were detected in your data pipelines:' || chr(10) || chr(10) || :error_details
      );
    end;
Enabling the Alert
The created alert needs to be enabled:
-- Enable the alert
alter alert event_db.sales_dept.datapipeline_error_alert resume;
Testing the Alert
Let's execute the same queries that generated errors earlier:
-- Create a task in the raw layer that will error out
create or replace task raw_db.sales.error_orders_task
    warehouse = compute_wh
    schedule = 'using cron 0 */1 * * * utc'
as
-- Query that will generate an error (clearly insufficient number of columns)
insert into raw_db.sales.orders (order_id, customer_id, order_date, product_id, quantity, price)
select
    'ord-' || to_varchar(uniform(1000, 9999, random()));

-- Enable and manually execute the task
alter task raw_db.sales.error_orders_task resume;
execute task raw_db.sales.error_orders_task;

-- Create a Dynamic Table in the stg layer that will error out (data type error)
create or replace dynamic table stg_db.sales.error_orders
target_lag = '1 minute'
warehouse = compute_wh
as
select
    order_id,
    customer_id,
    -- Intentionally cause a data type error (converting string to date)
    'not-a-valid-date'::date as order_date,
    product_id,
    quantity,
    price,
    price * quantity as total_amount,
    current_timestamp() as processed_timestamp
from raw_db.sales.orders;

-- Create a Dynamic Table in the mart layer that will error out (division by zero)
create or replace dynamic table mart_db.sales.error_sales_summary
target_lag = '5 minutes'
warehouse = compute_wh
as
select
    product_id,
    sum(quantity) as total_quantity,
    sum(price) as total_price,
    -- Intentionally cause a division by zero error
    sum(price) / (sum(quantity) - sum(quantity)) as avg_price -- Division by zero
from raw_db.sales.orders
group by product_id;
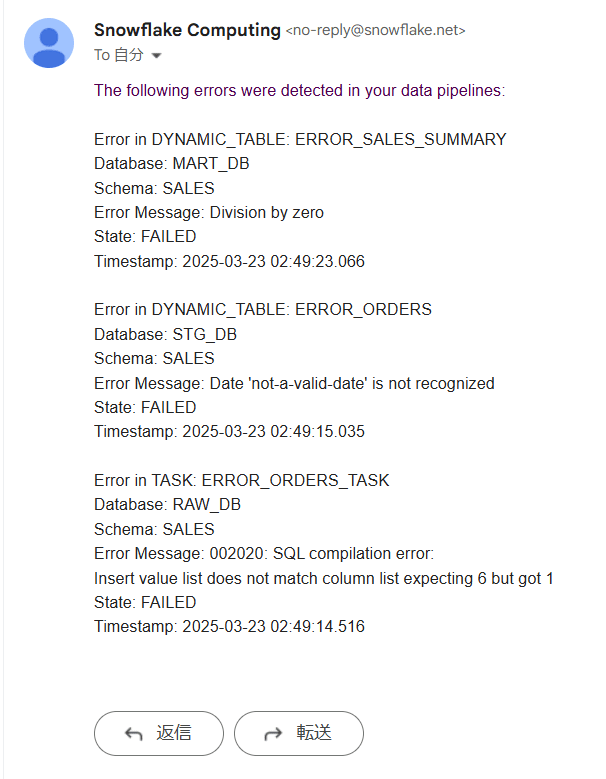
About a minute after executing these queries, I received an email as shown below! Since we generated three errors, all three were included in a single email notification.
Bonus: Checking Alert Execution History
As a bonus, let's check the alert execution history with the following query:
https://docs.snowflake.com/ja/user-guide/alerts#label-alerts-history
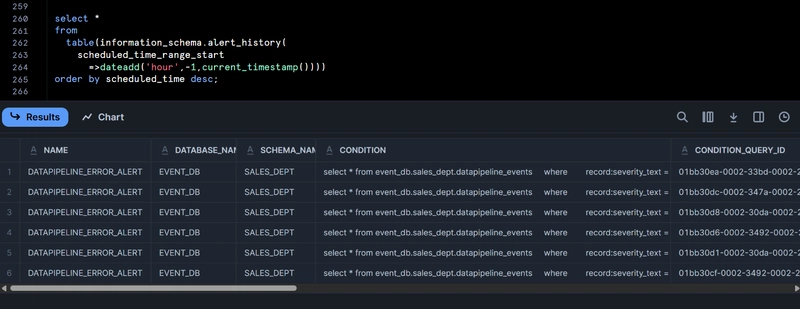
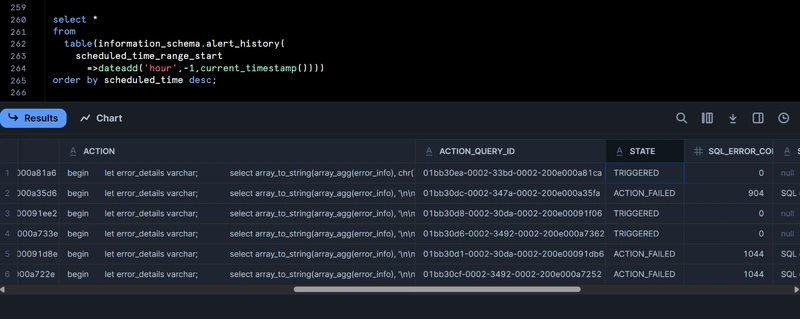
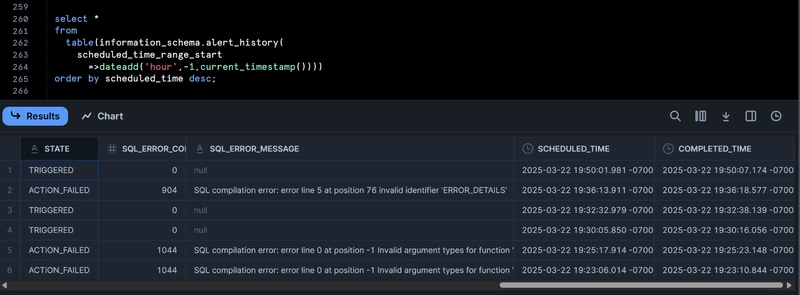
select *
from
  table(information_schema.alert_history(
    scheduled_time_range_start
      =>dateadd('hour',-1,current_timestamp())))
order by scheduled_time desc;
The history was recorded as shown below. For each record with a TRIGGERED status, one email was sent. (There are multiple execution logs and some with action_failed status because I was troubleshooting when the alert wasn't working properly.)
Conclusion
I've demonstrated how to use Snowflake's new feature to set up alerts that trigger when new records are added to a target table, specifically for monitoring task and Dynamic Table errors.
Previously, while tasks could easily be configured with Notification Integration for error notifications, Dynamic Tables required more complex setups with stored procedures and tasks as described in this blog post. This new feature makes it much easier to implement practical monitoring!
Additionally, alerts previously required defining queries that would run periodically, consuming warehouse resources. With this new feature, alerts can now run only when new records are added, using serverless resources, making it much more cost-effective.
This is a highly versatile feature that I encourage you to try out for your own use cases!

Top comments (0)