
Distributed Tracing is a divisive topic. Once the doyen of every KubeCon, the technology was expected to revolutionize observability.
Fast forward 5 years, the hype has subsided somewhat, there's a lot more talk about the pain, and adoption is moderate. Meanwhile, there continues to be steady activity around expanding and standardizing the technology - Open Telemetry (based on OpenTracing) is the 2nd largest CNCF project after Kubernetes. So what is the deal with Distributed Tracing? Should one implement it right away or wait and watch? In this article, let's explore Distributed Tracing in depth -
- What is special about Distributed Tracing and why do we need it?
- What are the problems with distributed tracing today?
- What are upcoming developments and how do they address existing challenges?
Introduction - How Distributed Tracing Works
For the uninitiated, Distributed Tracing is a technology that allows us to track a single request as it traverses several different components/ microservices of a distributed environment. Each network call made in the request's path is captured and represented as a span.

Why we need distributed tracing
To enable this, distributed tracing tools insert a unique trace context (trace ID) into each request's header and implement mechanisms to ensure that the trace context is propagated throughout the request path.

How a distributed trace represents a request path
Why we need Distributed Tracing in the first place
Distributed tracing is unique because it focuses on a request as the unit for observability. In a monitoring/ metrics platform, a component (e.g., a service, host) is the fundamental unit that is being observed. One can ask these platforms questions about the behavior of this unit as a whole, over time. For example, what is this service's health/ throughput /error rate in a specific timeframe?
With logs, the fundamental unit being observed is an event - e.g., whenever an event occurs during code execution, print some information. These "events" are subjectively defined by developers while writing code. The challenge with logs is that they are all disjointed, with each component printing its own form of log messages in isolation, with no easy way to connect them together to make sense.
In contrast, with distributed tracing what is being observed is a single request as it traverses several components. This allows us to ask questions about the distributed system as a whole and understand what occurred where in a complex, interconnected system.

View across metrics, logs, and distributed tracing
The basic case for distributed tracing lies in the argument that this orientation around requests is the closest to the end user's experience. And as a result, it is also the most intuitive for how we'd like to examine and troubleshoot distributed architectures.
The evolution of Distributed Tracing
Distributed Tracing has risen in importance due to the widespread adoption of distributed software architectures in the last decade.
The modern microservices-based architecture is an evolution from the late 90s internet growth story, when it became common to use request-response systems.
"With the late 90s and explosive growth of the internet, came the huge proliferation of request-response systems, such as two-tier websites, with a web server frontend and a database backend... Requests were a new dimension for reasoning about systems, orthogonal to any one machine or process in aggregate."
- Distributed Tracing in Practice, O'Reilly Media
In these microservices architectures, every single request ends up hitting many (10s or even 100s of microservices), making several network calls in between. Refer below for Uber's microservices architecture, which has 3000+ services.

Uber's microservices architecture from 2018. Source: https://www.uber.com/en-IN/blog/microservice-architecture/
In such complex systems, distributed tracing becomes critical for any form of troubleshooting. As a result, Distributed Tracing was pioneered by large companies that were early adopters using large, complex, distributed environments.
Google's Dapper paper released in 2010 was the beginning of distributed tracing
In the next few years, two more companies open-sourced their own distributed tracing systems (Twitter open-sourced Zipkin in 2012 and Uber open-sourced Jaeger in 2017). Zipkin and Jaeger continue to be among the most popular distributed tracing tools even today
Since 2016, there has been a significant effort to standardize distributed tracing across components through the OpenTracing project. OpenTracing eventually became OpenTelemetry in 2019. OpenTelemetry is widely popular and has thousands of contributors globally
Now Distributed Tracing is widely regarded as the third "pillar" of observability alongside metrics and logs. Most major monitoring and observability players provide distributed tracing tools as part of their products.
State of Distributed Tracing: Theory vs Reality
However, despite the promise, excitement, and community effort, the adoption of distributed tracing today is around ~25%. It is not uncommon to find companies on microservices architectures who are making do with logs and metrics, even though they clearly need distributed tracing.

Distributed Tracing adoption
At the same time, Mean-Time-To-Resolve production errors are going up in the world today. 73% of companies report it takes over an hour to resolve production issues today.

Increasing production MTTRs
Ask any developer what the most painful moments in their life are and they'll talk about time spent debugging a Sev-1 error in production with what seemed like a few hundred people breathing down their neck.
Seems then, that any company that cares about its MTTR (which is nearly every company) should be using distributed tracing, and the adoption should have skyrocketed in this environment. But the actual numbers do not support that - so what gives?
Challenges with Distributed Tracing today
There are several problems with distributed tracing today that companies have to overcome to get value - all of which don't get discussed as widely in the mainstream narrative.
1. Implementation is hard!
To implement distributed tracing in a service today, we need to make a code change and a release. While making code changes is a common-enough ask for observability, the challenge specifically with distributed tracing is this - e*very service or component* needs to be instrumented to get a distributed trace, or the trace breaks.

Each service has to be instrumented with an agent
One cannot just get started with a single service - as one can with monitoring or logging - and realize value. Distributed tracing requires instrumentation across a collective set of services to generate usable traces.
This requires coordination across several teams and service owners to make changes in their services. So it becomes an organizational problem- imagine getting 100s of teams to instrument their services over several months before you can realize value.
This is the biggest challenge with distributed tracing today.
2. Need for complex sampling decisions
Next, the volume of trace data generated by Distributed Tracing can be overwhelming. Imagine hundreds of services each emitting a small amount of trace data for every single request. This is going to be millions of requests per second, and makes distributed tracing expensive both in terms of storage and network bandwidth.
While logging also does the same thing (and emits more data per request, which is then managed by massive log aggregation tools), the difference is that most companies today already have logging. Introducing one more data type which is going to be almost as voluminous as logging is a daunting task and will likely double the spend.
To handle this problem of cost, all distributed tracing systems today use sampling and record only a subset of traces. The common sampling rates in practice today are between 0.1% to 2%. The rationale is that even 1% of samples are sufficient to give a decent aggregate picture of where the performance bottlenecks are.
Most platforms today let customers choose their sampling strategy and make their own cost-visibility trade-offs. However, this decision process adds to the already complex overhead of instrumenting and managing a distributed tracing system.
3. But sampling meaningfully diminishes the value
Let's assume a company goes through the effort of instrumenting every service/ component and then deciding the sampling strategy to ensure they don't break the bank.
What now - should we expect MTTR to drop dramatically? No, because developers can't use distributed tracing to actually troubleshoot issues, because of sampling.
Imagine a developer's experience - "I can't find the issue I know is there. I generated the error, but I cannot find the corresponding trace".
So what happens? Developers stop trusting the quality of distributed tracing data and revert to their regular methods for debugging/ troubleshooting (i.e., using logs)
4. Developer usage is low frequency
Given these constraints, today Distributed Tracing is primarily sold as a way to troubleshoot performance problems.
Remember that a basic distributed trace really just tells us who called who and how long each span took. Distributed traces don't tell us what happened within the service that caused the error/ high latency. For that, developers still have to look at the log message and/ or reproduce the issue locally to debug.
In a typical company, performance issues are likely <10% of the total. So in reality, distributed tracing is only useful for this small segment of issues.
The average developer who ships and owns a service is using a distributed tracing tool maybe 2-3 times a year.
Impact of all these challenges
In summary -
- Distributed tracing is hard to implement
- Distributed Tracing needs extensive sampling to control costs
- But sampling reduces the value considerably
- As a result, developers only use tracing for the odd one-off performance use case
All this makes the RoI case for distributed tracing quite fuzzy.
In a typical hype cycle, what we can say is that we are now past the stage of inflated expectations and disillusionment is beginning to settle in.
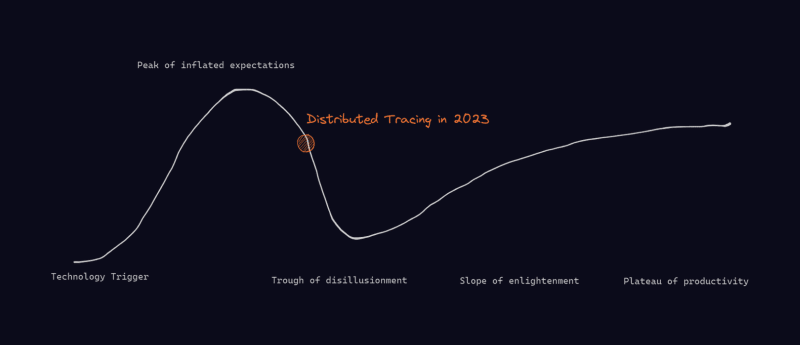
Hype cycle - Distributed Tracing
If we think in terms of end-state though, if the future of computing systems is distributed, then distributed tracing is naturally the most fundamental vector for observability. In that world, any company with a distributed architecture uses tracing as the primary mechanism for troubleshooting anything occurring in production - true "observability" - vs the passive monitoring of systems we have today.
Before we can get to that end-state though, we will need several improvements over the status quo. The good news is that much of this is already underway. Let's look at each of them. So what can we expect to see in the future?
Future of distributed tracing
Instant instrumentation with no code changes
Imagine dropping in an agent and being able to cover an entire distributed system (all services, components) in one go without code changes.
This looks realistically possible in the next 2-3 years.
OpenTelemetry's auto-instrumentation libraries already enable this for some programming languages (however fall short in compiled languages such as Go). In parallel, technologies like eBPF are evolving to enable system-wide instrumentation with no code change. Between the two, we can safely expect the instrumentation problem to be solved in a few years.
Sampling gives way to AI-based selection of requests-of-interest
In an LLM world, random sampling begins to look like a relic from the dark ages. Ideally, we should be able to look at 100% of traces, identify anything that looks anomalous, and store that for future examination. No more random sampling.
If we think about it, we don't really care about the ~95% "happy requests". We only care about the ~5% of anomalous traces - errors, exceptions, high latency, or some form of soft errors. So we just need a way to look at 100% and pick out the interesting 5%.

Traces we care about
There are mechanisms like tail-based sampling that aim to do this today. In tail-based sampling, the system waits until all the spans in a request have been completed, and then based on the full trace, decides whether it has to be retained.
The main challenge with tail-based sampling is that you have to store all the spans of a trace until the whole request is completed and then decide whether to keep/ discard the trace. This means we store every single request, with all the spans, for a certain period (until the request completes) - this requires a separate data architecture with components for load-balancing, storage & processing which is highly complex and expensive.
OpenTelemetry has a tail-based sampling collector, however, it is not yet mature and has several scalability challenges (due to the problem mentioned above). Meanwhile, several companies including ZeroK.ai are working on using AI to make anomaly detection efficient and scalable.
With the fast pace of development in this space, we can reasonably expect this problem to also be solved in the next 3-5 years.
The emergence of "rich" distributed traces that enable all debugging
A true leap into the next generation of tracing will be when tracing evolves from the realm of "performance issues only" to "all issues". That is when the true power of distributed tracing is unleashed.
For this to be possible, each trace needs to have rich context.
Imagine a scenario where each span in each trace has:
- Request & response payloads (with PII masking)
- Stack traces for any exceptions
- Logs
- Kubernetes events
- Pod states
- And anything else that occurred along that span
All in one integrated, seamless flow.
And imagine if the trace one is looking for is super easy to find - there are no sampling-related data gaps, issues are deduped & grouped, and can be filtered across several dimensions.
This then, is all a developer needs to debug any software issue. And potentially, all an AI model needs to diagnose and point a developer to what's going wrong
In this world, the trace becomes the primary axis for observability, replacing logging. That is what the end-state of distributed tracing could look like - while it's not here yet, it is visible from where we are today.
The main barrier to making this possible is the explosion in data volume that storing all this context data will cause. We will require deep innovation in data processing and storage architectures to make this possible. It is still early days yet and we have to wait and see what happens here.
Summary
In summary, Distributed Tracing is a necessary and intuitive view required for being able to observe distributed application architectures in production.
The first generation of distributed tracing, while promising, has been beset by several challenges which have made it difficult for companies to get value from tracing, which has stymied adoption somewhat.
However, several exciting developments are occurring in the space which are expected to make tracing easier, simpler, and more powerful than what we have today, making observability more seamless in the future.

Top comments (0)