Introduction
If you want to get into machine learning, I can’t think of a better way than start by learning Linear regression.
In this article, you will get a clear vision on what is linear regression, hypothesis function, and cost function.
Linear Regression is one of the most straightforward algorithms.
It is easy to understand and known by all data scientists and machine learning engineers.
also, it’s a very good starting point to learn other machine learning algorithms.
yet, linear regression is a very useful and efficient algorithm,
when used in the right problem with the right dataset.
In this article, we will go step by step to understand how linear regression is working.
So let’s not waste more time and get started.
What is a regression in the first place ?!
In statistical modeling, regression is the process of forecasting a dependent variable (Y). based on one or more of an independent variable (X).
in other words, a regression model is a statistical tool used to find the relation between the output (Y). and the input (X).
Linear Regression Algorithm.
The linear regression model is the basic form of regression analysis,
it estimates that the relation between the dependent and independent variables is linear.
We know from linear algebra that the straight-line equation :
y = mx+ b
we will use this equation to predict the output variable (y) with the relation to x( feature), m ( the slope of a straight line ), and b ( intersection of st-line with y-axis ).

equation of blue line y = x + 2
equation of red line y = 2x + 0
hypothesis equation
hypothesis equation is the st-line equation used in the machine learning algorithm with optimized parameters to best fit the data.
it’s a model that maps inputs to outputs and is used to make predictions.
the basic idea here or in any machine learning problem is:
feed the model with data.
test the model by predicting values you already know.
optimize the model for better predictions, and now you have a working machine learning model that can predict outputs.
let’s change the parameters of the st-line equation m → θ2, b → θ1

Let's give different values for theta (θ1,θ2) and see how the line changes.

we see that as θ2 changes the angle (slope) of the st-line changes and as θ1 changes the line intersection with the y-axis changes.
Accuracy
when our models make predictions, it’s not 100% accurate
in classification problems where the prediction is binary ( 0 or 1 )
the ratio between right predictions and wrong predictions is the model accuracy
if our model predicts 7 out of 10 right predictions so, the accuracy of the model equal to 70%
Cost function
Now we have a model that makes predictions by the hypothesis equation and we want to know how well are those predictions
in simple words, the cost function tests how well the model performs,
if the cost function is equal to zero, then the model is 100% accurate.
different from accuracy cost function is not a percentage
but, calculated by the error difference between the predicted value (ŷ) and expected value ( True value) (y).
Mean Squared Error

MSE = Mean Squared Error
m = number of training examples ( samples ).
i = index of sample
ŷ = predicted value
y = expected value
the predicted value ŷ is the output of the hypothesis while the expected value y is the value of training examples.

let’s use this dummy plot to get an intuition about how the MSE works.
the orange line height is the difference between the predicted value and the expected value (blue dot ).
let’s predict Y for these three values of X (3,4,6)
when
x =3 the predicted value ŷ = 3.9 while the expected value y = 2
x =4 the predicted value ŷ = 4.7 while the expected value y = 6
x =6 the predicted value ŷ = 5.8 while the expected value y = 4
now we calculate the cost with the MSE formula
we just have 3 training examples m = 3
MSE = 1/ 2* 3 ( (3.9–2)² + (4.7–6)² + (5.8–4)² )
MSE = 1/6 ( (1.9)² + (-1.3)² + ( 1.8)² ) = 1.42
of course, if we have a large dataset the cost will be much higher than that number.
I hope you’ve got an intuition about how cost function works, if not then am sure that the little project in the next section will give you a better understanding of the whole process.
Weight prediction based on height.

I picked 20 samples of weights and heights from a dataset so we can have a better understanding of the linear regression algorithm
first, we’ll plot the data then draw a regression line to make our predictions and see our model working.
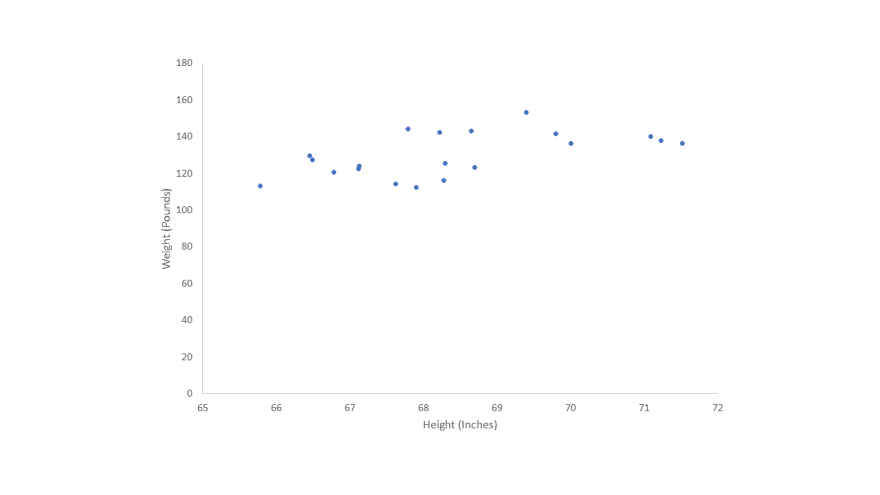
Regression Line
Now we have a plot with height (x-axis)(independent variable) and weight (y-axis)(dependent variable).
it’s time to draw the regression line using the hypothesis equation
y = θ1 + θ2. x
But, how do we choose the θ1 and θ2 parameters?
Ok, that’s where Gradient Descent comes to play, it’s a learning algorithm used to choose the best values for parameters to best fit the data, therefore, minimize the cost function (prediction error ).
we’ll talk about gradient descent in another article and for now, let’s say we have chosen the optimized parameters to draw the regression line.

and here comes the interesting part, let’s make a prediction,
I want our model to predict the weight of a 70 inches, let’s do it

it predicted ~135 pounds for 70 inches, if we look in our dataset table you’ll find 70.1 inches with 136.4 pounds.
so, we can say that our simple model has good accuracy.
Recap
In this article, we went through the main idea behind linear regression and how it works.
Regression is the process of finding the relation between input and output.
Linear regression algorithm estimates that the relation between the dependent and independent variables is linear.
The hypothesis function is the straight-line equation used in the machine learning model to map the input to output.
Cost function tests the accuracy of the hypothesis function by calculating the average difference between the predicted value and the actual values from the dataset.

Latest comments (0)