Performance regressions are something that I find rather hard to track in an automated way. For the past years, I have been working on a tool called fd, which is aiming to be a fast and user-friendly (but not necessarily feature-complete) alternative to find.
As you would expect from a file-searching tool, fd is an I/O-heavy program whose performance is governed by external factors like filesystem speed, caching effects, as well as OS-specific aspects. To get reliable and meaningful timing results, I developed a command-line benchmarking tool called hyperfine which takes care of things like warmup runs (for hot-cache benchmarks) or cache-clearing preparation commands (for cold-cache benchmarks). It also performs an analysis across multiple runs and warns the user about outside interference by detecting statistical outliers¹.
But this is just a small part of the problem. The real challenge is to find a suitable collection of benchmarks that tests different aspects of your program across a wide range of environments. To get a feeling for the vast amount of factors that can influence the runtime of a program like fd, let me tell you about one particular performance regression that I found recently².
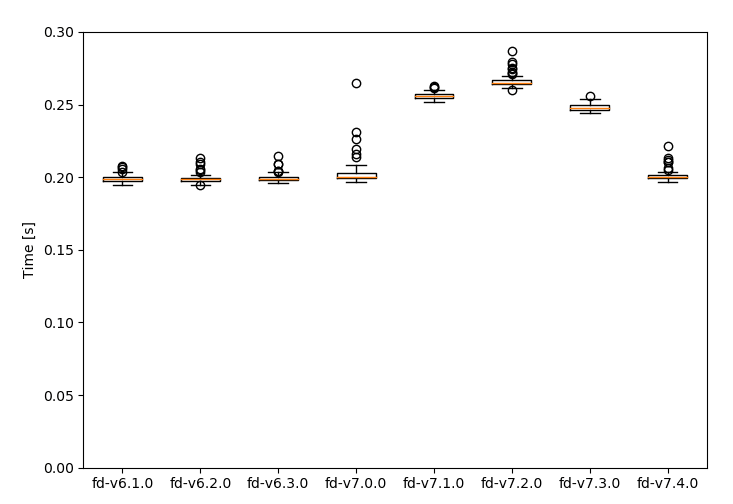
I keep a small collection of old fd executables around in order to quickly run specific benchmarks across different versions. I noticed a significant performance regression between fd-7.0.0 and fd-7.1.0 in one of the benchmarks:

I quickly looked at the commits between 7.0 and 7.1 to see if there were any changes that could have introduced this regression. I couldn't find any obvious candidates.
Next, I decided to perform a small binary search by re-compiling specific commits and running the benchmark. To my surprise, I wasn't able to reproduce the fast times that I had measured with the precompiled binaries of the old versions. Every single commit yielded slow results!
There was only one way this could have happened: the old binaries were faster because they were compiled with an older version of the Rust compiler. The version that came out shortly before the fd-7.1.0 release was Rust 1.28. It made a significant change to how Rust binaries were built: it dropped jemalloc as the default allocator.
To make sure that this was the root cause of the regression, I re-enabled jemalloc via the jemallocator crate. Sure enough, this brought the time back down:
Subsequently, I ran the whole "benchmark suite". I found a consistent speed up of up to 40% by switching from the system-allocator to jemalloc (see results below). The recently released fd-7.4.0 now re-enables jemalloc as the allocator for fd.
Unfortunately, I still don't have a good solution for automatically keeping track of performance regressions - but I would be very interested in your feedback and ideas.
Benchmark results
Simple pattern, warm cache:
| Command | Mean [ms] | Min [ms] | Max [ms] | Relative |
|---|---|---|---|---|
fd-sysalloc '.*[0-9]\.jpg$' |
252.5 ± 1.4 | 250.6 | 255.5 | 1.26 |
fd-jemalloc '.*[0-9]\.jpg$' |
201.1 ± 2.4 | 197.6 | 207.0 | 1.00 |
Simple pattern, hidden and ignored files, warm cache:
| Command | Mean [ms] | Min [ms] | Max [ms] | Relative |
|---|---|---|---|---|
fd-sysalloc -HI '.*[0-9]\.jpg$' |
748.4 ± 6.1 | 739.9 | 755.0 | 1.42 |
fd-jemalloc -HI '.*[0-9]\.jpg$' |
526.5 ± 4.9 | 520.2 | 536.6 | 1.00 |
File extension search, warm cache:
| Command | Mean [ms] | Min [ms] | Max [ms] | Relative |
|---|---|---|---|---|
fd-sysalloc -HI -e jpg '' |
758.4 ± 23.1 | 745.7 | 823.0 | 1.40 |
fd-jemalloc -HI -e jpg '' |
542.6 ± 2.7 | 538.3 | 546.1 | 1.00 |
File-type search, warm cache:
| Command | Mean [ms] | Min [ms] | Max [ms] | Relative |
|---|---|---|---|---|
fd-sysalloc -HI --type l '' |
722.5 ± 3.9 | 716.2 | 729.5 | 1.37 |
fd-jemalloc -HI --type l '' |
526.1 ± 6.8 | 517.6 | 539.1 | 1.00 |
Simple pattern, cold cache:
| Command | Mean [s] | Min [s] | Max [s] | Relative |
|---|---|---|---|---|
fd-sysalloc -HI '.*[0-9]\.jpg$' |
5.728 ± 0.005 | 5.723 | 5.733 | 1.04 |
fd-jemalloc -HI '.*[0-9]\.jpg$' |
5.532 ± 0.009 | 5.521 | 5.539 | 1.00 |
¹ For example, I need to close Dropbox and Spotify before running fd benchmarks as they have a significant influence on the runtime.
² As stated in the beginning, I don't have a good way to automatically track this. So it took me some time to spot this regression :-(

Top comments (9)
There's a nice project called asv (airspeed velocity) which can track benchmark performance across commits, graph them, track different machines separately, track different options separately, and look for step-changes in performance asv.readthedocs.io/en/stable
It's designed for Python, but I've used it with Haskell and Racket projects. There are two steps to making it generic:
Use a plugin to set up the "environment". This tells asv how to turn a raw commit into a runnable program (fetching dependencies, compiling, etc.). asv comes with Python-specific virtualenv and conda environments. I made a plugin to use the language-agnostic Nix package manager instead chriswarbo.net/git/asv-nix
Use "tracking" benchmarks. asv benchmarks are Python functions; for a tracking benchmark, asv just looks at its return value (i.e. it doesn't get timed or anything). If we want to perform measurements using some other program (e.g. a Rust binary), we can have our Python function execute that binary and return some number parsed from the output. More practically, we could have a "setup function" run the binary and parse out all of our measurements into e.g. a dictionary; then each "tracking benchmark" just returns the relevant value from that dictionary.
asv's "matrix" option allows different versions of dependencies to be benchmarked and compared, e.g. in your case it could be different Rust compilers. In fact these "dependency versions" are just argument strings which are provided to the environment plugin (e.g. my Nix environment passes them into Nix as arguments to the (user-specified) build function), so you could have a "dependency" called use-jemalloc with "versions" true and false, and have your environment build things as appropriate.
It's easy enough to integrate asv with CI (I personally use Laminar). Instead of invoking a local binary we could do it over SSH instead (e.g. on a dedicated machine, to reduce interference); we can do anything we like to get that return value ;)
Thank you very much for the feedback. This looks very promising!
Thank you for the feedback! Yes - I am using Travis and Appveyor for CI. I'm sure we could somehow install hyperfine. But there are many open questions:
Agreed on the first two, I wouldn't expect a docker machine in testing to behave similarly to a physical one but maybe you can rent some dedicated server? Though it could be expensive...
Hi David, short of having a bunch of Docker test machines that run automatically to run the benchmarks at each commit or so I don't know how you could test this semi consistently with past versions.
I'd imagine that if your operating system gets upgraded that also might affect the benchmark output...
That's interesting. In my toy compiler project the system allocator's and jemalloc's performance is almost indistinguishable, even though there are lot of allocations made during parsing, semantic checking and IR construction, and IO is negligible (it just reads the entire source file at once). On the other hand, mimalloc 1.0.3 (via mimallocator crate) speeds it up by 15-18% and mimalloc 1.0.8 (no crate yet, via LD_PRELOAD) by about 22%.
Thank you for your feedback! I hadn't heard about mimalloc. I quickly tried it out via the mimallocator crate and the results for all of the benchmarks show that mimalloc is either on par or a tiny bit faster than jemalloc (1%). I'll take a closer look at this. There are also other things to consider, like availability on certain platforms (jemalloc via jemallocator does not work on Windows and for musl-libc builds).
jemallocworks for thegnutargets, but not the MSVC targets yet. I speak as the person who filed the PR fixing that specific target. :)Yes, I noticed that when integrating it here: github.com/sharkdp/fd/pull/481 For now, jemalloc is not enabled on Windows