As a data engineer, have you ever dreamed of building a data pipeline that autonomously adjusts its performance and reliability in real-time? Sounds like science fiction, right? Well, it's not! In this article, we'll explore the concept of self-optimizing data pipelines.
What is a Self-Optimizing Data Pipeline?
A self-optimizing data pipeline is an automated system that dynamically adjusts its performance and reliability in real-time based on incoming data volume, system load, and other factors. It's like having a super-smart, self-driving car that navigates through the data landscape with ease!
Concept Overview
A self-optimizing data pipeline automates the following:
- Performance Optimization: Dynamically adjusts parameters like partition sizes, parallelism, and resource allocation based on incoming data volume and system load.
- Error Handling: Detects and resolves pipeline failures without manual intervention (e.g., retrying failed tasks, rerouting data).
- Monitoring and Feedback: Continuously monitors system performance and learns from past runs to improve future executions.
- Adaptability: Adapts to varying data types, sources, and loads.
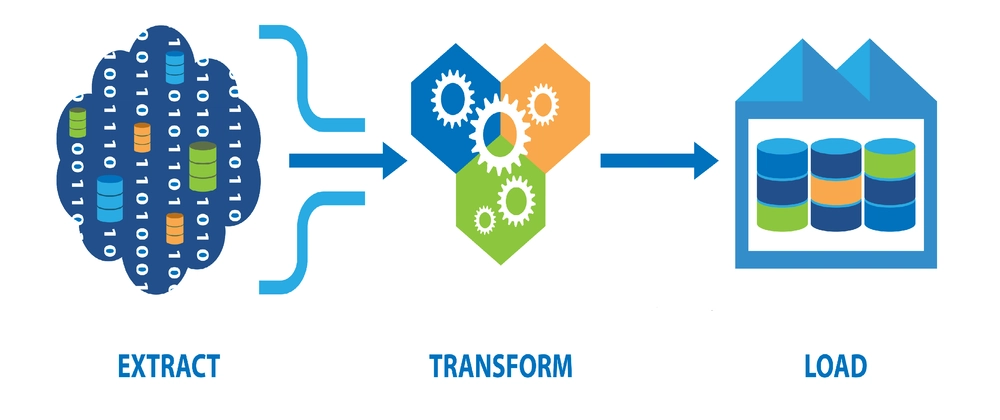
Self-Optimization in ETL Process
1. Data Ingestion
• Goal: Ingest data from multiple sources in real time.
• Implementation:
◦ Use Apache Kafka or AWS Kinesis for real-time streaming.
◦ Ingest batch data using tools like Apache NiFi or custom Python scripts.
• Self-Optimization:
◦ Dynamically scale consumers to handle varying data volumes.
◦ Monitor lag in Kafka partitions and scale producers or consumers to maintain low latency.
2. Data Transformation
• Goal: Process and transform data into a usable format.
• Implementation:
◦ Use Apache Spark for batch processing or Apache Flink for stream processing.
◦ Implement transformations like filtering, joining, aggregating, and deduplication.
• Self-Optimization:
◦ Partitioning: Automatically adjust partition sizes based on input data volume.
◦ Resource Allocation: Dynamically allocate Spark executors, memory, and cores using workload metrics.
◦ Adaptive Query Execution (AQE): Leverage Spark AQE to optimize joins, shuffles, and partition sizes at runtime.
3. Data Storage
• Goal: Store transformed data for analysis.
• Implementation:
◦ Write data to a data lake (e.g., S3, HDFS) or data warehouse (e.g., Snowflake, Redshift).
• Self-Optimization:
◦ Use lifecycle policies to move old data to cheaper storage tiers.
◦ Optimize file formats (e.g., convert to Parquet/ORC for compression and query efficiency).
◦ Dynamically adjust compaction jobs to reduce small file issues.
4. Monitoring and Feedback
• Goal: Track pipeline performance and detect inefficiencies.
• Implementation:
◦ Use Prometheus and Grafana for real-time monitoring.
◦ Log key metrics like latency, throughput, and error rates.
• Self-Optimization:
◦ Implement an anomaly detection system to identify bottlenecks.
◦ Use feedback from historical runs to adjust configurations automatically (e.g., retry logic, timeout settings).
5. Error Handling
• Goal: Automatically detect and recover from pipeline failures.
• Implementation:
◦ Build retries for transient errors and alerts for critical failures.
◦ Use Apache Airflow or Prefect for workflow orchestration and fault recovery.
• Self-Optimization:
◦ Classify errors into recoverable and unrecoverable categories.
◦ Automate retries with exponential backoff and adaptive retry limits.
6. User Dashboard
• Goal: Provide real-time insights into pipeline performance and optimizations.
• Implementation:
◦ Use Streamlit, Dash, or Tableau Public to create an interactive dashboard.
• Self-Optimization:
◦ Allow users to adjust pipeline parameters directly from the dashboard.
Tech Stack
1. Ingestion: Kafka, Kinesis, or Apache NiFi.
2. Processing: Apache Spark (for batch), Apache Flink (for streaming), Python (Pandas) for small-scale transformations.
3. Storage: AWS S3, Snowflake, or HDFS.
4. Monitoring: Prometheus, Grafana, or CloudWatch.
5. Workflow Orchestration: Apache Airflow, Prefect.
6. Visualization: Streamlit, Dash, or Tableau Public.
Example Self-Optimization Scenarios
1. Scaling Spark Executors:
◦ Scenario: A spike in data volume causes jobs to run slowly.
◦ Action: Automatically increase executor cores and memory.
2. Handling Data Skew:
◦ Scenario: Some partitions have significantly more data than others.
◦ Action: Dynamically repartition data to balance load.
3. Retrying Failed Jobs:
◦ Scenario: A task fails due to transient network issues.
◦ Action: Retry with exponential backoff without manual intervention.


Top comments (0)