What is SigNoz?
SigNoz is an open-source alternative to DataDog, New Relic etc. It is a full-stack application monitoring and observability platform, which can be used to track both metrics and traces. Link to our GitHub repo 👇
 SigNoz
/
signoz
SigNoz is an open-source APM. It helps developers monitor their applications & troubleshoot problems, an open-source alternative to DataDog, NewRelic, etc. 🔥 🖥. 👉 Open source Application Performance Monitoring (APM) & Observability tool
Monitor your applications and troubleshoot problems in your deployed applications, an open-source alternative to DataDog, New Relic, etc.
Documentation • ReadMe in Chinese • ReadMe in German • ReadMe in Portuguese • Slack Community • Twitter
SigNoz helps developers monitor applications and troubleshoot problems in their deployed applications. SigNoz uses distributed tracing to gain visibility into your software stack.
Join our Slack community
Come say Hi to us on Slack
Features:
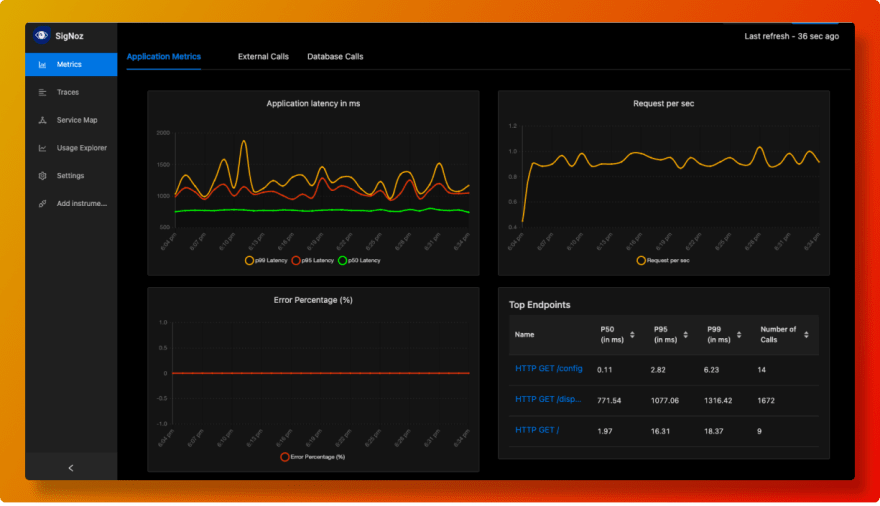
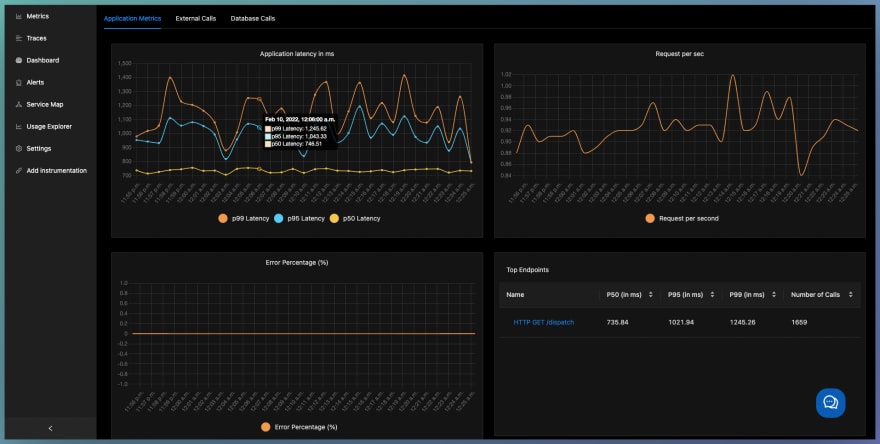
- Application overview metrics like RPS, 50th/90th/99th Percentile latencies, and Error Rate
- Slowest endpoints in your application
- See exact…
Launching support for ClickHouse
In our latest release v0.3.2 , we launched support for ClickHouse as storage backend for SigNoz. ClickHouse is a column-oriented database management system (DBMS) for online analytical processing of queries (OLAP). Now when you install SigNoz, you will have the option to choose between ClickHouse or Kafka + Druid as a database system.

In this article, let's dig deeper into why we decided to introduce support for Clickhouse as a database storage system and how our users can benefit from it.
Community demands for ClickHouse
As an open-source software, we build what our community wants. We listened to demands from our community for supporting ClickHouse as a storage backend.

As a storage backend, ClickHouse is less resource-intensive than using Kafka + Druid. It makes getting started with SigNoz much quicker, and users can now try out SigNoz on their local machine easily as the entire setup takes less than 1.5GB of memory space.
Why Clickhouse for SigNoz?
Improvements in installation time
One of the key focus area of our engineering team is to make trying out SigNoz as simple as possible. Extending support for ClickHouse as a database is part of one such initiative.
As we are self-hosted and open source, you can try SigNoz out in a matter of a few minutes to understand how it can help you with performance monitoring.
You can get started with SigNoz with just three commands at your terminal:
$ git clone https://github.com/SigNoz/signoz.git
$ cd signoz/deploy/
$ ./install.sh
You can then proceed with either ClickHouse or Kafka+Druid installation set up. On a macOS 2017 model with 8 GB RAM, following were the installation times in seconds for the two set ups:
- ClickHouse set up: 93.99 seconds
- Kafka + Druid set up: 269.25 seconds
So in just over a minute, you will be able to access our dashboard with the Clickhouse set up on your local host.
Improvements in memory usage
Let's analyse the performance of ClickHouse and Kafka+Druid set ups with docker stats command. The docker stats command displays a live data stream with CPU, memory usage, memory limit, block I/O, and network IO metrics for all the running containers.
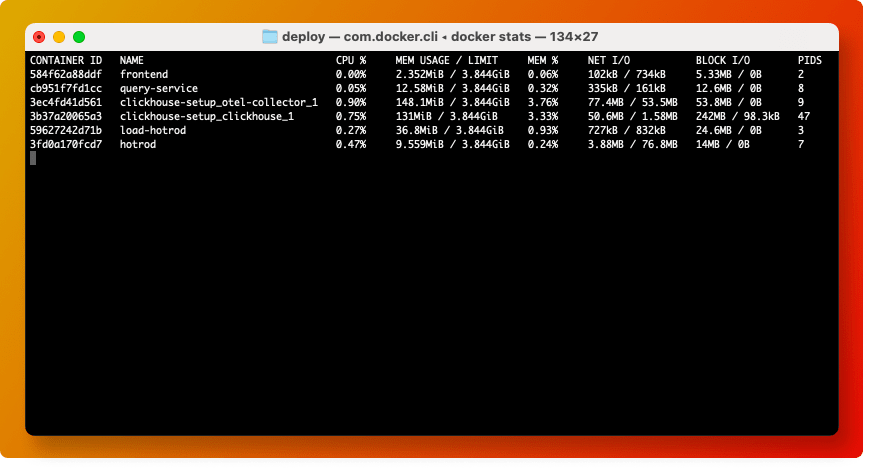
Total memory usage with ClickHouse set up: 340.391 MiB
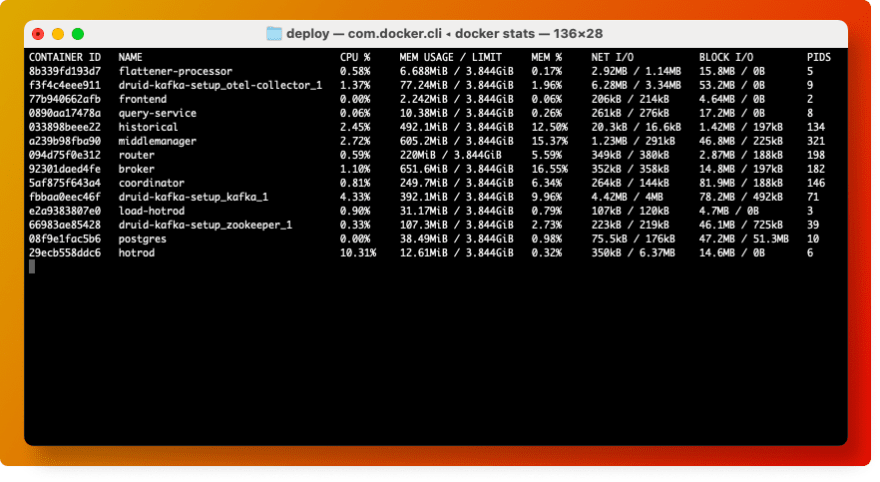
Total memory usage with Kafka + Druid set up: 2,896.82 MiB
As we can see, the ClickHouse set up uses about 8.5x less memory than the Kafka + Druid set up for getting started with SigNoz. It makes trying out SigNoz much easier for developers even on their local machine.
SigNoz architecture with ClickHouse

With ClickHouse as the storage backend, OpenTelemetry collector directly writes to ClickHouse. The query service makes queries to ClickHouse to fetch relevant data points and display it on the frontend UI.
We will also be soon bringing support for long term storage from ClickHouse to S3.
Upcoming features in the ClickHouse set up
We will soon be enabling custom metrics in SigNoz with the ClickHouse storage backend. Metrics represent the health of your system over time and are a crucial component of observability. SigNoz uses OpenTelemetry for instrumentation and you can measure metrics like p99, p50 latency, etc.
And with custom metrics you will be able to define more specific metrics to gauge the health of your system.
As an open-source monitoring tool, we want to provide our users flexibility in setting up monitoring for their services. Monitoring data is often critical and private to a company, and as such, users should have flexibility in choosing a database that their teams feel most comfortable with. Providing support for different storage backends is an effort in this direction.
SigNoz is also self-hosted, so you don't need to send your critical data to SaaS vendors outside your cloud. Visit our GitHub repo, and try out SigNoz in a matter of minutes.
We are constantly looking out for community feedback and will be pleased to hear from you.
 SigNoz
/
signoz
SigNoz is an open-source APM. It helps developers monitor their applications & troubleshoot problems, an open-source alternative to DataDog, NewRelic, etc. 🔥 🖥. 👉 Open source Application Performance Monitoring (APM) & Observability tool
Monitor your applications and troubleshoot problems in your deployed applications, an open-source alternative to DataDog, New Relic, etc.
Documentation • ReadMe in Chinese • ReadMe in German • ReadMe in Portuguese • Slack Community • Twitter
SigNoz helps developers monitor applications and troubleshoot problems in their deployed applications. SigNoz uses distributed tracing to gain visibility into your software stack.
Join our Slack community
Come say Hi to us on Slack
Features:
- Application overview metrics like RPS, 50th/90th/99th Percentile latencies, and Error Rate
- Slowest endpoints in your application
- See exact…




Top comments (0)