Learning about the tools Chrome has made available through DevTools can better equip you to find bottlenecks in a site's performance.
I'm an avid Chrome DevTools user, but when I first started web development I pretty much only stuck to the Elements and Console tabs. As for the rest of them, there was a lot going on. After gaining familiarity with the importance of the remaining data Chrome DevTools provides, it has advanced my craft as well as elevated my sense of responsibility as a developer.
Specifically, I'd like to begin with the Network tab. The DevTools Documentation suggests to refer to the Lighthouse feature solely for performance improvement, which seems on the surface to do the work for us. I'll be addressing Lighthouse as well, but understanding the Network Tab will empower you to actually tackle those weak points of your site's performance a Lighthouse audit will expose.
Setting the Scene
What does the Networks tab on DevTools show us?
Network is a general term for various things connected to each other, which the internet is an example of. Devices like servers, personal computers, and phones are connected to the internet to allow data to be exchanged. Information related to the Network of our page can show us how our webpage behaves as a part of this universe, as it makes requests and requires processing time.
Chrome DevTools shows us extensive details of the loading experience for all of a webpage's resources, including but not limited to its size, the type of asset, and what page initiated its loading.
With this information you can also play around with what and how your page is requesting certain items like testing how might blocking a specific stylesheet affect a page's performance, or how the page would load on a 3G connection.
Reviewing DevTools' Network Information
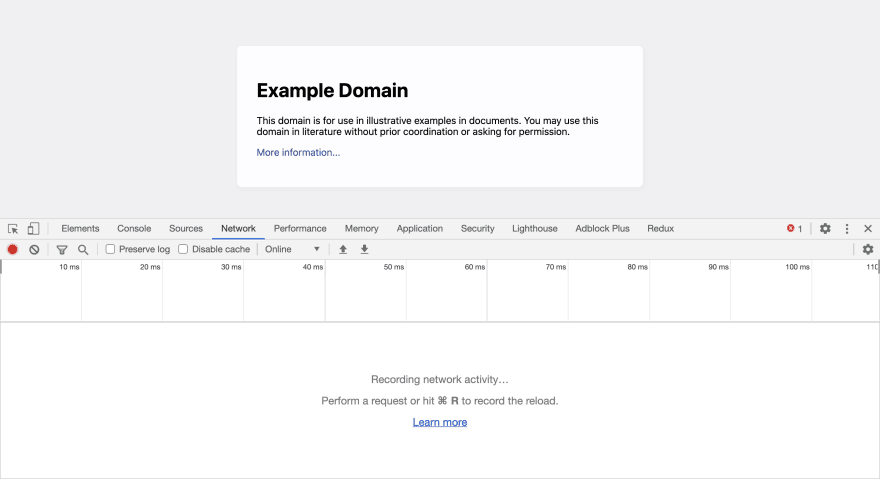
When you first open the Network tab it's going to be empty because DevTools only logs network activity while it's open.
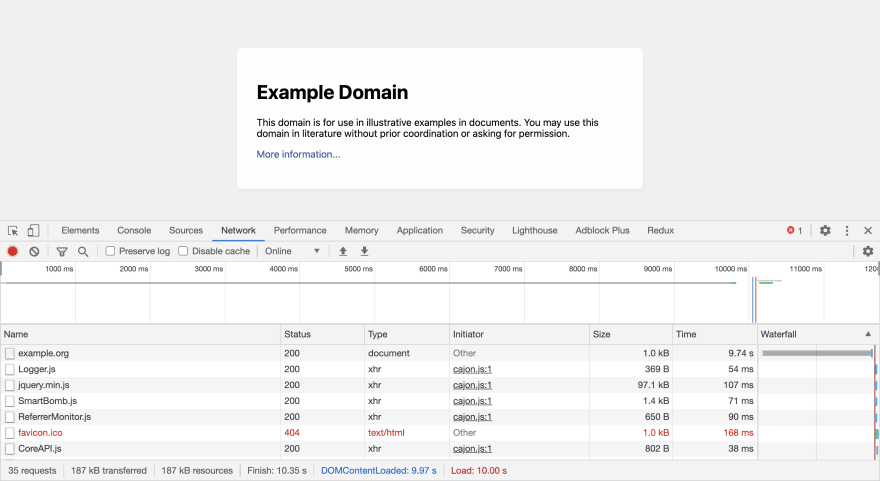
So, let's refresh with DevTools open and watch what it logs.
There's a few key things I want to point out first:
1 - The bottom section you now see filled with rows are resources. Resources are the different assets the page relies on to load fully. They are listed in the order in which they were requested, with the last resource that is requested being listed at the end.
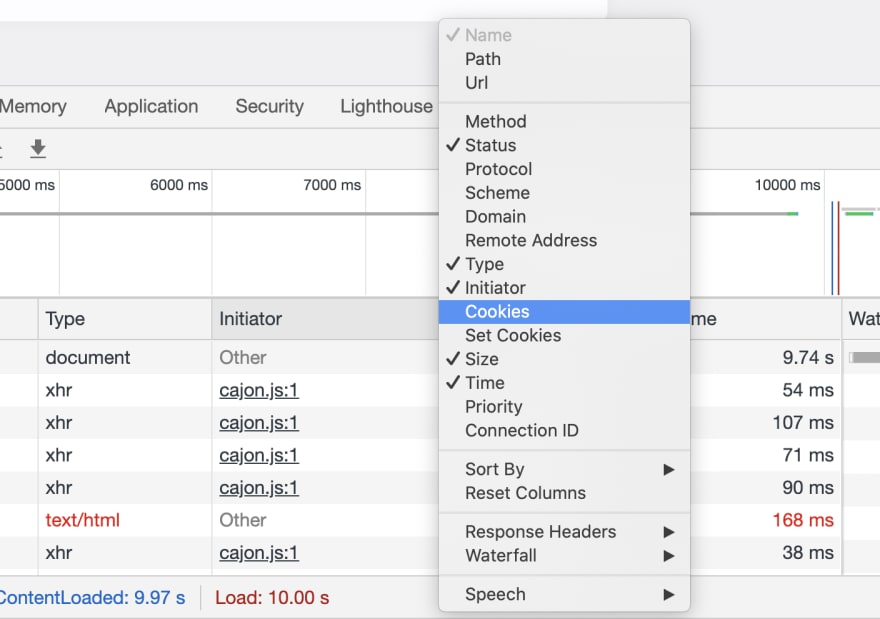
2 - The columns in the resources section can be adjusted however you like. You can remove columns or add ones that aren't listed by right-clicking the header of the table.
Let's look at what some of the default titles mean:
Type - What is it? png, stylesheet?
Initiator - What page made the request for this resource to get pulled in? You can try clicking around the page you are inspecting to test which buttons, forms, hovers and more caused this request
Time - How long did the request for that resource take?
3 - You can also click on a resource to learn more about its details
Some of the titles you might see:
Headers - Which headers were used to pass information between the client and server about this resource?
Preview - What does the resource look like?
Response - The resource's source code
Timing - Breakdown of how long this resource took to load
Playing around with DevTools' Features
This is the fun part - getting to test the page against various conditions.
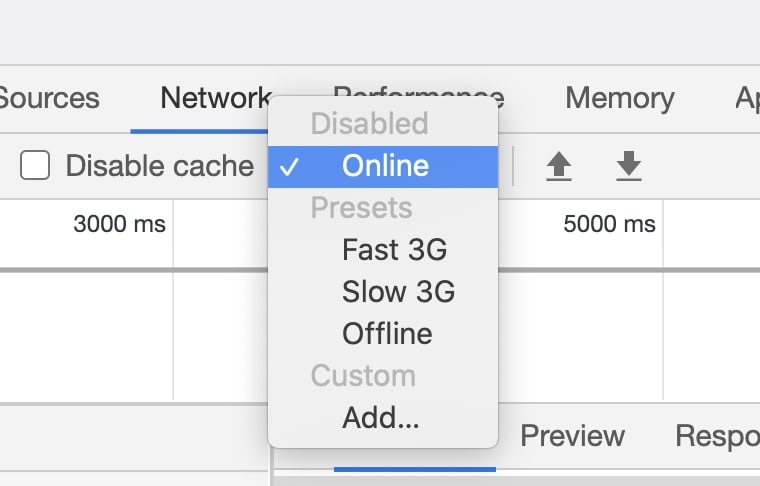
One of these conditions is Throttling. Throttling allows you to slow down your internet connection to experience it like a mobile user or just with a connectivity other than one you may be used to and have built the site with. If you bring your attention to the top of DevTools you'll see a dropdown that's likely already selected to be "Online."
You can select the speed in which you're interested in testing. If you do change it, you want to make sure you do a "Empty Cache and Hard Reload" (long press the refresh button on the top left of the browser window) so that the website can't rely on any cache to load the page's assets.
I mentioned earlier you can also block requests from getting a resource. To do this, hit Control+Shift+P or Command+Shift+P to open the Command Menu. Type block, then select Show Request Blocking. Hit "Add pattern" and in the text box that appears you can enter any kind of file types or names of files to see how the page would behave without that resource. For example, if I type in *.css it will block all loaded CSS stylesheets. Make sure you refresh the page to watch the changes happen.
Lighthouse
With a basic understanding of what we can find out and manipulate about a webpage on the Network, how can we now use this to improve a site's performance?
Chrome has provided a great tutorial on using Lighthouse to Optimize your Website speed, and I've pulled out from it the critical steps which highlight the process:
- You want to start by running a performance audit of your site to get a baseline of your site's performance before you make any improvements. To do this, open the page you'd like to improve in an incognito window (better for Chrome DevTools to work off of a clean canvas)
- Click on the Lighthouse tab in DevTools (third to last tab for me). Here you can check off the conditions in which you'd like to put your page to the test. For the purposes of this discussion, make sure you have performance checked off. Hit "Generate report".
- Take some time to look through the analysis. If you scroll to the performance section, you should see a score at the top but that doesn't really mean much until you've made sense of the reasonings behind the scoring which the breakdown of the Metrics section below shows us. For each metric you can hover over and see in further explanation what they are assessing. For example, "First Contentful Paint" tells you how long it took for the user to see content on their page.
- Diagnostics section will tell you specifically what's causing any kind of lag
- The opportunities section is the most helpful here - you can take the suggestions they offer you to play around with the removal or rearrangement of various assets on the Network tab with the knowledge you've gained from earlier in this post. You can also test out in the project itself how text compression, minifying, or any other performance tweaks will affect another Lighthouse audit.
Closing Thoughts
Keep playing around with the Network tab on DevTools some more. Understanding what the tab can expose for you as well as using Lighthouse to keep your performance metrics in check will help supercharge your site's experience for all.
Cover photo from The Verdict.


Top comments (0)