
TL;DR: Learn to visualize e-commerce website traffic data with an AI-powered smart WPF Chart. This blog covers using Azure OpenAI for data cleaning and preprocessing, including handling missing values and outliers. It demonstrates integrating Azure OpenAI with Syncfusion WPF Charts to create accurate and insightful visualizations. For detailed steps, check out the GitHub demo.
Data visualization is a powerful tool, but the accuracy of your charts heavily depends on the quality of the data. In many cases, raw datasets are incomplete, noisy, or contain outliers that can skew the results. This is particularly true for web traffic data, which may have gaps, spikes, or other anomalies. Before you visualize such data with a chart, it’s crucial to clean and preprocess it.
Syncfusion WPF Charts control contains several data storage and rendering optimizations to achieve the best possible performance when plotting large volumes of data, as well as handling high-frequency, real-time updates.
Its Empty Points support helps manage missing data points in your chart. When a missing value is encountered, the WPF Charts control can handle it in several ways, including showing an empty space, connecting the previous and next data points, or even displaying the average value of the surrounding data points.
Even though the WPF Chart’s empty point support is a useful feature; relying on AI for data cleaning provides the following additional benefits to your visualization:
- Contextual knowledge: Instead of simply averaging to the nearest values, AI can analyze trends, detect patterns, and make more informed decisions about filling gaps.
- Outlier detection and correction: AI can identify abnormal spikes or drops in your data and suggest corrections based on the overall trend, ensuring that your visualizations are not distorted by erroneous data.
- Customized data cleaning: AI-driven data cleaning is flexible and can be customized to meet specific needs, whether it’s smoothing data, interpolating missing values, or applying domain-specific rules.
- Comprehensive preparation: Azure OpenAI can perform multiple preprocessing tasks simultaneously, such as handling missing values, correcting outliers, and normalizing data.
In this blog, we’ll see how to create a smart WPF Chart using Azure OpenAI to assist in data cleaning and preprocessing for e-commerce website traffic data. We’ll also display the cleaned data using the Syncfusion WPF Charts control in our application.
Let’s get started!
Step 1: Integrating Azure OpenAI with a WPF app
First, ensure that you have access to Azure OpenAI and have created a deployment in the Azure portal. You can find the Azure.AI.OpenAI NuGet package from the NuGet Gallery.
Once you get your key and endpoint, follow these steps:
Set up Azure OpenAI
We’ll assume using the GPT-35 model deployed under the name GPT35Turbo. Let’s start creating the OpenAIService. Refer to the following code example.
internal class AzureOpenAIService
{
    const string endpoint = "https://{YOUR_END_POINT}.openai.azure.com";
    const string deploymentName = "GPT35Turbo";

    string key = "";

    public AzureOpenAIService(string key)
    {
        this.key = key;
    }
}
Connect to the Azure OpenAI
In our WPF app, we should set up a connection to the Azure OpenAI service, as shown in the following code example.
// At the time of required.
var client = new OpenAIClient(new Uri(endpoint), new AzureKeyCredential(key));
This connection allows you to send prompts to the model and receive responses, which you can use for data-cleaning tasks.
Step 2: Data cleaning and preprocessing
Let’s assume your dataset looks something like the following one:
| Date | Visitors |
|------------|----------|
| 2024-08-01 | 1200 |
| 2024-08-02 | | // Missing value
| 2024-08-03 | 1300 |
| 2024-08-04 | 1500 |
| 2024-08-05 | 10000 | // Outlier
This dataset has missing values and outliers (e.g., 10,000 visitors on 2024-08-05, which is unusually high).
To clean this data, you can prompt Azure OpenAI to identify and handle these issues. Here’s an example of how you can frame your prompt:
var prompt = $"Clean the following e-commerce website traffic data, resolve outliers, and fill missing values:\n{string.Join("\n", rawData.Select(d => $"{d.DateTime:yyyy-MM-dd-HH-m-ss}: {d.Visitors}"))} and the output cleaned data should be in the yyyy-MM-dd-HH-m-ss:Value";

var client = new OpenAIClient(new Uri(endpoint), new AzureKeyCredential(key));
var response = await client.GetChatCompletionsAsync(chatCompletionsOptions);
Step 3: Preparing the data for the chart
Let’s define the WebsiteTrafficData class with the following properties:
- DateTime: Stores the time of visiting the website.
- Visitors: Stores the count of visitors.
// Data model.
public class WebsiteTrafficData
{
    public DateTime DateTime { get; set; }
    public double Visitors { get; set; }
}
Then, define a ViewModel class that encapsulates the web traffic data and provides a convenient way to access it in the view.
public class ViewModel : INotifyPropertyChanged
{
    public ObservableCollection<WebsiteTrafficData> RawData { get; set; }

    private ObservableCollection<WebsiteTrafficData> cleanData;
    public ObservableCollection<WebsiteTrafficData> CleanedData
    {
       get { return cleanData; }
       set
       {
           cleanData = value;
           PropertyChanged?.Invoke(this, new PropertyChangedEventArgs("CleanedData"));
       }
    }

    private bool isBusy;
    public bool IsBusy
    {
       get
       {
          return isBusy;
       }
       set
       {
          isBusy = value;
          PropertyChanged?.Invoke(this, new PropertyChangedEventArgs("IsBusy"));
       }
    }

    public ViewModel()
    {
        IsBusy = false;
        RawData = new ObservableCollection()
        {
           new WebsiteTrafficData{ DateTime = new DateTime(2024, 07, 01, 00, 00, 00), Visitors = 150 },
           new WebsiteTrafficData{ DateTime = new DateTime(2024, 07, 01, 01, 00, 00), Visitors = 160 },
           new WebsiteTrafficData{ DateTime = new DateTime(2024, 07, 01, 02, 00, 00), Visitors = 155 },
           new WebsiteTrafficData{ DateTime = new DateTime(2024, 07, 01, 03, 00, 00), Visitors = double.NaN },

           // Missing data
           new WebsiteTrafficData{ DateTime = new DateTime(2024, 07, 01, 04, 00, 00), Visitors = 170 },

           // Some more data.
           …
        };

        CleanedData = new ObservableCollection<WebsiteTrafficData>();
    }
}
In the code above, we have created two properties to store the web traffic data:
- RawData: Contains the raw data, including empty values.
- CleanedData: Contains the data with empty values replaced.
Step 4: Design WPF Charts to visualize website traffic data
First, refer to the getting started with WPF Charts documentation. To visualize website traffic data, we’ll use two line series to show data for before and after AI data cleaning.
Refer to the following code example.
xmlns:syncfusion="clr-namespace:Syncfusion.UI.Xaml.Charts;assembly=Syncfusion.SfChart.WPF"
. . .
<syncfusion:SfChart Palette="Custom" Margin="5" >

    <syncfusion:SfChart.ColorModel>
        <syncfusion:ChartColorModel>
            <syncfusion:ChartColorModel.CustomBrushes>
                <SolidColorBrush Color="#ffa600"/>
                <SolidColorBrush Color="#58508d"/>
                <SolidColorBrush Color="#ff208d"/>
            </syncfusion:ChartColorModel.CustomBrushes>
        </syncfusion:ChartColorModel>
    </syncfusion:SfChart.ColorModel>

    <syncfusion:SfChart.PrimaryAxis>
        <syncfusion:DateTimeAxis LabelFormat="hh tt" ShowGridLines="False" EdgeLabelsDrawingMode="Shift">
            <syncfusion:DateTimeAxis.LabelStyle>
                <syncfusion:LabelStyle FontSize="12.8"/>
            </syncfusion:DateTimeAxis.LabelStyle>
        </syncfusion:DateTimeAxis>
    </syncfusion:SfChart.PrimaryAxis>

    <syncfusion:SfChart.SecondaryAxis>
        <syncfusion:NumericalAxis ShowGridLines="False">
            <syncfusion:NumericalAxis.LabelStyle>
                <syncfusion:LabelStyle FontSize="12.8"/>
            </syncfusion:NumericalAxis.LabelStyle>
        </syncfusion:NumericalAxis>
    </syncfusion:SfChart.SecondaryAxis>

    <syncfusion:FastLineSeries x:Name="CleanedDataSeries" ItemsSource="{Binding CleanedData}" XBindingPath="DateTime" YBindingPath="Visitors"/>

    <syncfusion:FastLineSeries x:Name="RawDataSeries" ItemsSource="{Binding RawData}" XBindingPath="DateTime" YBindingPath="Visitors"/>

</syncfusion:SfChart>
Now, the chart will look like the following image with empty values.
Let’s configure AI service to process raw data and return cleaned data. Refer to the following code example.
internal class AzureOpenAIService
{
    const string endpoint = "https://mobilemaui.openai.azure.com";
    const string deploymentName = "GPT35Turbo";

    string key = "";

    public AzureOpenAIService(string key)
    {
        this.key = key;
    }

    public async Task<ObservableCollection<WebsiteTrafficData>> GetCleanedData(ObservableCollection<WebsiteTrafficData> rawData)
    {
        ObservableCollection<WebsiteTrafficData> collection = new ObservableCollection<WebsiteTrafficData>();

        var chatCompletionsOptions = new ChatCompletionsOptions
        {
            DeploymentName = deploymentName,
            Temperature = (float)0.5,
            MaxTokens = 800,
            NucleusSamplingFactor = (float)0.95,
            FrequencyPenalty = 0,
            PresencePenalty = 0,
        };

        var prompt = $"Clean the following e-commerce website traffic data, resolve outliers, and fill missing values:\n{string.Join("\n", rawData.Select(d =>: $"{d.DateTime:yyyy-MM-dd-HH-m-ss}: {d.Visitors}"))} and the output cleaned data should be in the yyyy-MM-dd-HH-m-ss:Value";

        chatCompletionsOptions.Messages.Add(new ChatRequestUserMessage(prompt));
        try
        {
            var client = new OpenAIClient(new Uri(endpoint), new AzureKeyCredential(key));
            var response = await client.GetChatCompletionsAsync(chatCompletionsOptions);
            return GetCleanedData(response.Value.Choices[0].Message.Content, collection);
        }


        catch (Azure.RequestFailedException ex)
        {
            // The server is not connected, check the key and end point.
        }
    }


    ObservableCollection<WebsiteTrafficData> GetCleanedData(string json, ObservableCollection<WebsiteTrafficData> collection)
    {
        if (string.IsNullOrEmpty(json))
        {
            return new ObservableCollection<WebsiteTrafficData>();
        }

        var lines = json.Split('\n');
        foreach (var line in lines)
        {
            if (string.IsNullOrWhiteSpace(line))
                continue;

            var parts = line.Split(':');
            if (parts.Length == 2)
            {
                var date = DateTime.ParseExact(parts[0].Trim(), "yyyy-MM-dd-HH-m-ss", CultureInfo.InvariantCulture);
                var high = double.Parse(parts[1].Trim());

                collection.Add(new WebsiteTrafficData { DateTime = date, Visitors = high });
            }
        }
        return collection;
    }
}
Then, bind the cleaned data to the chart series based on the AI response.
// At application start.
Task.Run(async () =>
{
    var service = new AzureOpenAIService("YOUR_Azure_AI_Key");
    CleanedData = await service.GetCleanedData(RawData);
});
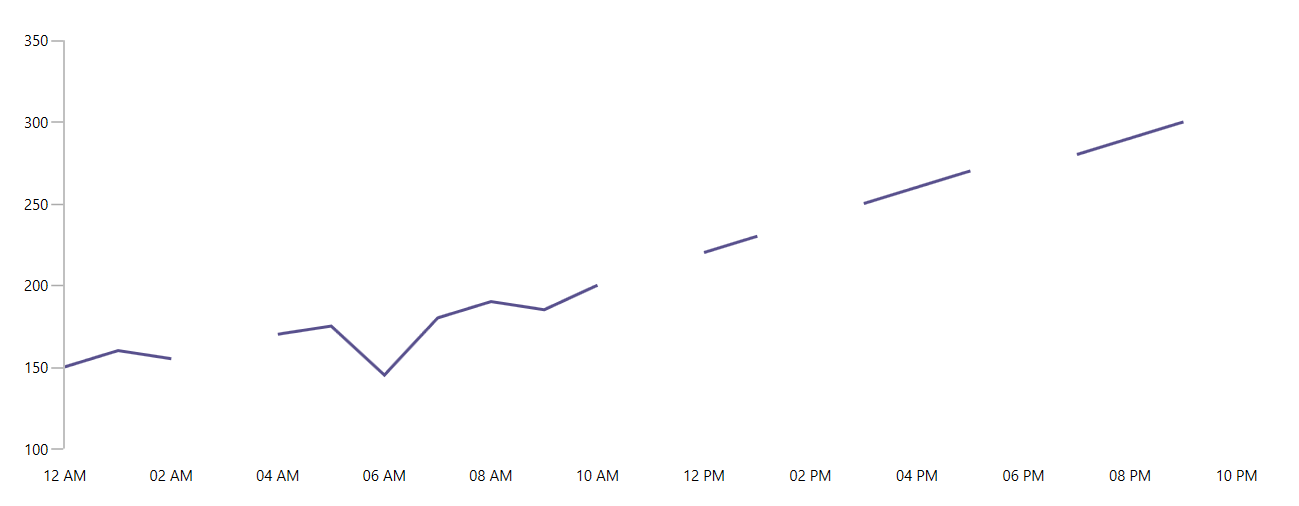
Now that your chart is set up with the cleaned data, you’ll see a smooth and accurate representation of your website traffic trends, free from anomalies and gaps.

GitHub reference
For more details, refer to the cleaning and preprocessing data using the AI-powered smart WPF Chart GitHub demo.
Conclusion
Thanks for reading! Using Azure OpenAI for data cleaning and preprocessing lets you easily handle messy datasets. By integrating this AI-driven approach into your WPF apps, you can ensure that your visualizations are based on clean, reliable data, ultimately leading to more accurate insights. The WPF Charts control provides a powerful platform for displaying this data, making it easy to spot trends and make informed decisions.
With this setup, you can focus more on interpreting the data than preparing it, making your workflow more efficient and productive.
The existing customers can download the latest version of Essential Studio from the License and Downloads page. If you are new, try our 30-day free trial to explore our incredible features.
If you need assistance, please do not hesitate to contact us via our support forum, support portal, or feedback portal. We are always eager to help you!
Related blogs
- Chart of the Week: Creating a WPF Chart Dashboard to Analyze 2024 T20 World Cup Statistics
- Chart of the Week: Creating a WPF Chart Dashboard to Visualize the 2023 World Billionaires List
- Chart of the Week: Creating A Trend Line Using WPF Charts to Visualize Rapid Heating in North American Oceans
- Visualize JSON Data Quickly Using WPF Charts

Top comments (0)