When developing an SDK running on all major platforms with bindings in half a dozen languages, you tend to run into interesting situations! Sometimes it's the kind of situation where the better part of a week turns into an extended debugging session. This is one of those times.
When we started developing our Golang SDK, we made the decision to reuse our native library instead of trying to rewrite everything. Ultimately it has proved to be the right choice for us, but it's not a very well-kept secret that Golang's interoperability story with C libraries is a little more complicated than for most languages.
Between the challenge of setting up cgo (Go's FFI system) to work with our build system and the various platform-specific issues we encountered, it's fair to say the development of our Go bindings had a bit of a bumpy start.
We were hopeful that things would start to settle down quietly after the initial work to get the Go SDK up and running. And if you're reading this, you won't be surprised to learn that the universe had other ideas.
First look
Monday comes around, and a Go unit test is failing. Armed with the fearless resolution of someone convinced that the hard part is already behind us, we get to work.
Strangely enough, the test seems to fail only when our native library is built in Release mode. But, before anything else, let's see what we can learn from the test suite's output.
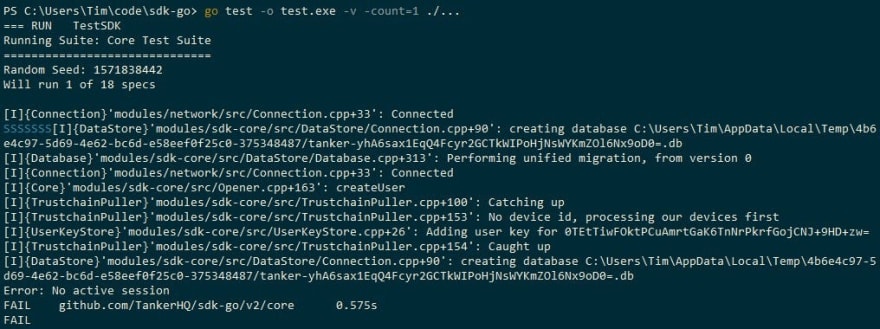
We get some entirely normal log messages for a test that starts a Tanker session, but it looks like the go test runner can't quite tell us which line caused the failure. We quickly decide that this is no reason to be worried. After all, how hard could fixing a single unit test be?
Let's take a closer look in a debugger.

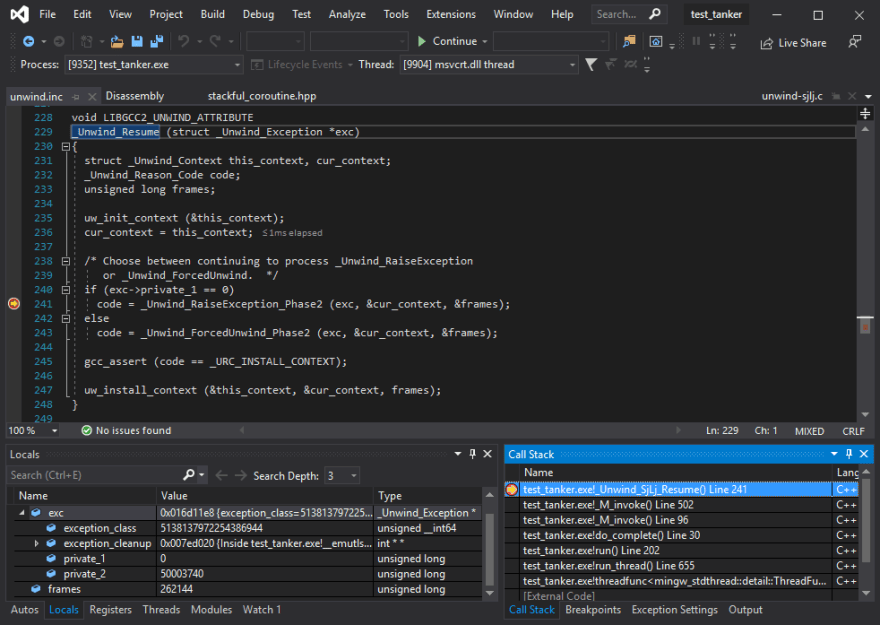
All right, so our test is actually crashing with an "Access violation at 0x00000000", the operating system's epitaph for programs in the dangerous business of dereferencing null pointers.
Already some of you may have noticed something unusual about this crash; instead of a regular Go or C++ function, Visual Studio claims our program is currently running code at address 0x00000000, as if there were a function there (there very much is not).
A closer inspection of the registers
For those curious about low-level details Visual Studio's "Registers" view is an even more interesting clue, although not strictly necessary; finding pieces of evidence is merely a guide that helps us make better debugging decisions. However, since this post is about to dig deep, let's take a moment to appreciate just how comprehensively wrong this crash is.
What this view shows is the CPU's hardware registers, and one of those in particular — called EIP — contains the address at which our program is currently trying to run code. As a matter of fact, we could already tell EIP would be 0 because of the access violation, but what's interesting is that the contents of most of the other registers are also conspicuously null!
Now that is a weird state to be in.
Accidentally handling null pointers can happen in the majority of mainstream languages, and corrupting memory is a dishearteningly common pastime for C programs, but registers are different. Even relatively low-level programming languages like C and C++ won't let you directly touch them (and for a good reason, those languages want to be portable, independent of hardware details). If all those registers ended up with zeros in them, this is either a particularly unlikely coincidence or the same malfunction that caused a jump to address 0 is responsible.
Knowing this, the hope of a simple programming mistake starts to wither away as this is no mere null pointer. Which leaves those pieces of code that do mess with registers as the prime suspects — assembly code gone rogue, or the compiler toolchain itself. Needless to say, neither of those possibilities is a particularly reassuring prospect.
Isolating the problem
To fix a crash like this reliably we must start by understanding what, exactly, is going wrong. The first step towards understanding this is isolating the problem. Once we've found that exact place where the tires leave the road, we can exculpate large parts of the codebase and try to reproduce the crash in a simplified environment. We need a Short, Self Contained, Correct, Example (also known as MCVE in some corners of the web).
Since the program crashes at the null address we don't have much surrounding context to look at, but we started with a failing Go unit test so let's go back to that in a debugger.
Thankfully, the bug looks deterministic (it fails in the same way every time), so we can follow the code until a function call crashes, repeat from a breakpoint inside the function, and quickly narrow down where things go south.
On the complexity of opening a debugger
Unfortunately for us there is a subtle difference between deterministic and predictable! A perfectly deterministic crash can disappear unless the conditions are just right (and taking a look at what makes a crash disappear can sometimes give us a hint as to what went wrong).
We found out that this bug requires a very specific situation: only the 32-bit version of our library, only on Windows, and only when compiled with MinGW in Release mode. And that means no debug symbols.
We checked that the Debug mode wouldn't crash, and against all hopes the RelWithDebInfo mode (a mix of Debug and Release) didn't crash either. But if we drill down into the compiler settings things are actually more subtle than Debug and Release. What seems to make the bug disappear when not making Release builds is when some specific optimizations — like inlining — are turned off.
Up to this point I had always thought that RelWithDebInfo meant exactly the Release mode with Debug information (the -g setting of the compiler) enabled, but surprise, it also turns off a bunch of optimizations, just enough to make a bug disappear!
Concretely, in our case, Release passes the -O3 flag to MinGW and RelWithDebInfo is only -O2. It turns out that if we take our Release build and manually add the -g flag everything crashes just fine. Awesome.
Finally, we can fire up the world renowned Visual Studio debugger and follow along, right?
Of course not! That would be too easy, and where's the fun in that?
We're using Go's FFI to call our library, and Go only really works well with libraries compiled by MinGW, not Visual Studio. But, you see, MinGW emits DWARF debug information, and Visual Studio doesn't want anything to do with that when it has its own PDB debug information format. There are a few ways to deal with this:
- A linux-native debugger like GDB understands DWARF and can still be used on Windows,
- We could get a really powerful cross-platform tool like IDA Pro that understands every format under the sun,
- Or we could somehow try translating the DWARF debug information into a PDB for the sake of Visual Studio.
Really, it's just a matter of personal preference (and having two to ten thousand dollars lying around for an IDA license). We went with option three.
And now we're fully ready; all that's left is the tedious process of stepping through until we stumble on the program's last few actions.

The unit test we're investigating tries to perform some invalid operations on purpose, so it's not surprising that the code would end up throwing an exception at some point, and we can see in the screenshot above the location where we catch it. No crash so far, but if we continue in our debugger the next thing the code does is stash the caught exception away in memory, step out of the handler, and promptly jump to 0x00000000 through a small maze of Boost.Context functions. As you might have guessed, this exception handler is special. So special in fact that we need to take a moment and talk about its purpose.
Taking a step back: tconcurrent
I have a confession to make — I've been hiding a few things from you. Now is probably a good time to reveal that our entire C++ library's internals are implemented as async coroutines that return futures and await each other.
"But wait," you might say. "C++ won't have coroutines until the 2020 revision of the standard, and the early support in compilers is still experimental!" All very true, dear reader.
And, at the time of writing we're in fact still held back from a full switch to C++17 due to a few legacy platforms, so we couldn't actually use the standard C++ coroutines even if they were ready.
Instead we took things into our own hands and built our own async/await on top of the existing and very low-level Boost.Context engine — this is our tconcurrent library. It allows us to write asynchronous code almost as easily as synchronous code by enabling us to use stackful coroutines. (And importantly, tconcurrent is also compatible with the C++ Coroutine TS, meaning that as soon as we get stable compiler support we'll be able to toggle the tconcurrent back-end from Boost.Context to C++'s compiler-backed stackless coroutines.)
So what does all of this have to do with our crash and the exception that was caught above? The exception handler we land in right before the crash actually belongs to tconcurrent.
Coroutines work by sharing an event loop running in a thread, and the exception handler we landed in is how tconcurrent prevents coroutines in their last throes from bringing down the whole program. Instead, it catches the exception and stores it in a future as the result of the prematurely terminated coroutine, and then switches back to the event loop.
Good artists copy, great artists reproduce
We now have a pretty good idea where the code is crashing and, good news, it doesn't look like it has anything to do with the code in our unit test or in the Go bindings for our library! Hopefully, we should be able to make it crash with just our native C++ SDK and tconcurrent, but in order to be completely sure, it's time to reduce and reproduce the bug.
There are two approaches to creating a minimal reproduction of a crash. One is to take the full crashing test case and chip away at it bit by bit until only the essence of the bug is left. The other is to start with a blank slate and try to re-create the simplified circumstances of the bug, omitting anything unnecessary.
The first way is methodic and reliable, but often slow and mind-numbingly tedious. For a large codebase with many moving parts it's often worthwhile to give the second approach a shot before falling back to the tried and true.
We found a way to reproduce it very quickly, and I can finally show you what that looks like:
#include <tconcurrent/coroutine.hpp>
#include <fmt/core.h>

tc::cotask<int> bad_coroutine()
{
    throw fmt::format("Yeet.");
}

int main()
{
    try {
        tc::async_resumable(bad_coroutine).get();
    } catch (const std::string& x) {
        return 1;
    }
}
This code is actually pretty simple once you get past the cotask and async_resumable jargon! It really is the shortest possible re-creation of our failing unit test's behavior. We have a coroutine bad_coroutine that throws an exception unconditionally, and a main that starts bad_coroutine and then immediately blocks to wait for its result — a std::string exception — that it tries to catch.
However, it isn't immediately clear why we bother to throw some fmt::formatted text instead of just a string literal or a number. This is where the chaotic nature of the bug shines through. Any small change to the code like throwing a different kind of object or changing the #include files can affect whether or not it will successfully trigger the bug. Also not visible is the fact that we still need to compile with all optimizations enabled, on 32-bit Windows, and with the MinGW compiler for the crash to happen.
We arrived at this code by trying to mimic the events observed in the debugger as straightforwardly as possible, but there is always a little guesswork involved. We were lucky to stumble on a combination of factors that happened to work in just a few tries. As a result, we were able to rule out most of our codebase as unrelated to the bug.
Getting Into the Thick of Things
Having simplified the problem as much as possible, we can now focus intensely on understanding what is going on. At the start of this debugging session, I was blissfully unaware of the internals of either Boost or tconcurrent and, in fact, a substantial part of this article was new to me just a week ago! We're about to dig deeper still into some intricate details learned from carefully reading source code, documentation, and specification documents, so a humble warning — the following is correct only to the best of my knowledge (and we'll leave a dark corner partly unexplored, namely that identifying the reason why the bug was so chaotic and sometimes did not crash wasn't necessary to understanding the cause and fixing it, but I'm keen to see if exceedingly curious readers can model a more complete explanation!).
The first thing we learned is that the symptom of the crash is jumping to address 0, but we haven't looked in detail at how this happens. So, let's start back from our breakpoint in the tconcurrent exception handler.
We now know that this catch block intercepts and saves exceptions that bubble out of coroutines, which means the bad_coroutine has already finished executing by the time we get there. After a quick look at tconcurrent's source code, we learn that the next step in the case of our code above is for tconcurrent to switch back from bad_coroutine to the event loop, and to wake up the main function that's currently still waiting for a result so we can re-throw the exception we just caught.
All the interesting business seems to be happening outside our minimized repro code above and into library internals. We talked earlier about how tconcurrent defers to Boost.Context for all the low-level platform-specific coroutine switching code, but it's time to peel off the abstractions and take a look at how coroutines really work!
A little bit more context
If you're not intimately familiar with them yet (as I wasn't), the advantage a coroutine has over a regular function is that it can suspend itself instead of blocking the thread, and another coroutine that's ready to run will be resumed in its place (a form of cooperative multitasking). Eventually, whatever the first coroutine was waiting for will become available, making it possible to resume it (at the time the second coroutine is next suspended). All of those coroutines can share and wait for their turn to run on the same thread, and in our case this is the thread that hosts the tconcurrent event loop.
This may sound a little convoluted compared to plain old blocking threads, but the whole point of the system is the large efficiency gain: having many coroutines consumes little memory and switching between them is considerably faster than having many blocked threads and relying on the operating system to juggle them (and the gap has been growing, as the recent waves of CPU vulnerability mitigations continue to increase the cost of thread switching). In fact, coroutines are often called lightweight threads because of this.
So, if coroutines are similar to threads, this means tconcurrent and especially Boost.Context are going to have a job that looks a lot like a simplified operating system scheduler. Just like a thread, each stackful coroutine has its own stack that we need to keep track of, and its own set of CPU registers that must be saved when we suspend and restored as we resume it. This is exactly what Boost.Context takes care of. A context object can be seen as a suspended coroutine and contains all the state necessary to resume it!
So, if we go back to our minimized code above, the control flow starts to become a little clearer. Conceptually we start in main and we create a new coroutine, with its own context and stack, for the bad_coroutine function (that's what tc::async_resumable does). Then we block main while the tconcurrent event loop switches to bad_coroutine.
As we switch away from the event loop we suspend it, and so Boost.Context gives us a corresponding context that we can use to resume the event loop as soon as bad_coroutine finishes executing.
Speaking of bad_coroutine, the first thing it does is throw an exception and so we end up in the tconcurrent exception handler.
We save the caught exception, and now that bad_coroutine has ended we try to resume our event loop using its saved context (and, at the same time, we can unblock our main now that we have a result).
And this last resume is the point where we end up zeroing half our registers and jumping to address zero. If there was ever a time to suspect that memory used by some horribly cursed intricately woven assembly code is getting corrupted, this is it!
To complicate matters slightly, the exact content of a context object (that is, the serialized state of a suspended coroutine in memory) and the way it is saved is extremely platform-specific — as evidenced by the x86 registers in it — so I'm going to talk only about what is used in our particular case of i386 Windows with the MinGW compiler. This is the cryptic table shown below and extracted from a comment in Boost.Context's low-level assembly files.
  -----------------------------------------------------------------
  |   0   |   1   |   2   |   3   |   4   |   5   |   6   |   7   |
  -----------------------------------------------------------------
  |   0h  |  04h  |  08h  |  0ch  |  010h |  014h |  018h |  01ch |
  -----------------------------------------------------------------
  | mxcsr | x87_cw|fi_strg|dealloc| limit |  base | fc_seh|  EDI  |
  -----------------------------------------------------------------
  -----------------------------------------------------------------
  |   8   |   9   |  10   |   11  |   12  |   13  |   14  |   15  |
  -----------------------------------------------------------------
  |  020h | 024h  | 028h  |  02ch |  030h |  034h |  038h |  03ch |
  -----------------------------------------------------------------
  |  ESI  |  EBX  |  EBP  |  EIP  |   to  |  data | EH NXT|EH HDLR|
  -----------------------------------------------------------------
What you see in each column of this table is a different piece of information that Boost.Context saves when a coroutine is suspended (or when its context is first created), but don't worry about what exactly each of those is for. What we're particularly interested in is the registers EDI through EIP, and if you remember the first time we looked at registers at the start of this article, you might be surprised that we're saving only a few of them in this table. This is a small trick of the ABI, callee-saved registers, that becomes important here.
Boost.Context uses a hand-written assembly routine to switch from one context to another, but to the compiler it looks like any other function, and like any other function on i386 Windows the compiler takes care to save some registers (on the stack) before calling the function, as mandated by the ABI. Also, like any other function, the compiler pushes the return address of the caller on the stack before doing the call, so that it knows where to return. This means that by the time we're in Boost.Context's assembly routine, a lot has already been saved onto the stack for us.
You might want to take some time to internalize this, because here comes the real magic: since each coroutine has its own stack, we know that as long as the coroutine is suspended anything we save on its stack is safe and won't be overwritten. So the assembly routine that suspends the coroutine can simply save the contents of the context right here on the stack while it's suspending, next to the return address and the callee-saved registers saved by the compiler!
And the context object that Boost.Context gives us is really just a pointer to this suspended coroutine's stack.
When it is time to resume Boost takes this pointer, restores the context's contents manually in assembly, uses it as its new stack pointer, and then "simply" returns from the magic assembly routine back to the calling code that originally suspended the coroutine — like any other function!
Okay, this is a lot to take in, so here's the takeaway — each coroutine has its own stack that no one touches while it's suspended, and saving the context on that stack is the last thing a suspended coroutine does. There's no obvious bug in the Boost code, and while the rest of the tconcurrent code does keep pointers to those stack contexts, the only times they are really used is when saving and resuming coroutines. So, if we don't have any particularly suspicious code that accesses the context, what could possibly be corrupting it and how do we find out?
To catch a corruption
Finally, we have a promising trail to follow, and a strong suspicion that the saved context we switch back to is being corrupted by something, since it somehow ends up filled with zeros when we try to resume it. The good news is that now that we have a precise target — the saved registers on the stack — there's one simple way to track whatever is causing this kerfuffle. Back to our debugger!
This time we're going to make use of a particularly awesome feature of x86 CPUs — hardware data breakpoints (these are sometimes known as watchpoints and emulated in software by single-stepping, which, unfortunately runs hundreds of times slower; the other side of that coin being that the hardware is limited to only four breakpoints at the same time).
The principle is as simple as it sounds. Instead of breaking on a line of code we're going to set a breakpoint on a location in memory and ask the debugger to break when the value in that location is modified.
Well, I didn't say this was going to be an easy bug — the data breakpoint takes us deep into the internal plumbing of the compiler runtime.
The actual corruption happens when some innocent-looking code saves a value on the stack — the completely wrong stack of our suspended event loop, overwritting our saved context! A buggy function or some invalid arguments causing the program to corrupt memory would have been perfectly normal and expected, but finding some internal runtime code merrily running on the wrong stack trampling all over our saved data is the special kind of fun one is really looking for in a debugging session.
The screenshot above is actually a little bit closer to familiar grounds, in a parent function of where the corruption usually happens (as the exact point depends on the chaotic behavior).
This is the function that'll send us to the next arcane topic everyone would really be better off never having to run into: _Unwind_SjLj_Resume.
SjLj and other four letter words
Have you ever wondered how exceptions are implemented by your compiler? No? Well, wonder no more. We're going to need a crash course in exception handling to understand what the code we landed into even is.
First of all, SjLj stands for Setjmp/Longjmp, an archaic way of implementing exception handling notorious for slowing programs in the common non-throwing path and based on an ancient standard C header that's otherwise best left alone.
There are of course better modern ways to implement exceptions, namely the Dwarf2 model which is common on Linux, or SEH-based exception handling which is a whole larger system integrated with Windows.
So why are we using SjLj, then? MinGW doesn't support SEH exceptions on i386 Windows, and as for Dwarf2 exceptions they come with their own explosive downsides since a thrown Dwarf2 exception will crash the program if it bubbles up into non-dwarf2 aware code (note though, this is actually OK in the case of our core library, since it currently exposes a C interface to bindings and doesn't leak exceptions). SjLj exceptions, apart from their age and ambient overhead, have a reputation for being a sane battle-tested default.
And what about this _Unwind_SjLj_Resume function we stopped in? This is where we run into the C++ exception handling ABI for Itanium. (Itanium is the experimental architecture that failed to become the x86_64 we use today, but did define most parts of our modern ABI).
While it makes for excellent bedside reading, I'm going to try and spare you as many of the boring details of the spec as possible. What we do need to know about this ABI is that it standardizes an interface for stack unwinding — the process of going up the stack and running exception handlers when a program throws an exception. One side of this interface is implemented by the compiler (in our case, with the SjLj method), and the other is the unwinding library described in the ABI. (And why isn't that unwinding library just an internal detail of the compiler? Because making it a separate language-independent facility enables C++ and other languages' exceptions to work together transparently, without needing every language to know about each other!)
There are ten functions provided by the unwinding library:
  _Unwind_RaiseException,
  _Unwind_Resume,
  _Unwind_DeleteException,
  _Unwind_GetGR,
  _Unwind_SetGR,
  _Unwind_GetIP,
  _Unwind_SetIP,
  _Unwind_GetRegionStart,
  _Unwind_GetLanguageSpecificData,
  _Unwind_ForcedUnwind
We don't need to understand the details of what each of these do — we can leave that to compiler writers — but we can see that _Unwind_Resume is defined here, which is, in fact, the same function as our _Unwind_SjLj_Resume. Now, according to the ABI document, this function is called after executing cleanup code in a partially unwound stack and at the end of a landing pad that performed cleanup, but did not resume normal execution. That's not very concrete, so let's look at what happens with the unwinding library when a program throws an exception.
A C++ throw statement is replaced by a call to __cxa_throw by the compiler, but the real work is delegated to the _Unwind_RaiseException function, which is called to start the stack unwinding process. This process works in two phases: the search phase walks up the stack through every stack frame to locate exception handlers, and if that first phase is successful the cleanup phase starts walking the stack frames again, but this time calling every exception handler found by the search phase on the way. (What happens if the search phase fails? That's an unhandled exception and the program terminates.)
So, to simplify, the cleanup phase is essentially responsible for running the destructor of every object that goes out of scope on the way to the nearest catch block. As far as the exception runtime knows, both destructors and catch blocks are exception handlers (what the spec calls landing pads), the main difference being that catch blocks stop the unwinding and resume normal code execution but, after a destructor is run, the frame's landing pad has to tell the runtime to continue going down the stack. And how does it do that? That's just what our _Unwind_Resume function does!
All right, so that doesn't quite tell us yet why _Unwind_Resume is running on the wrong stack, but at least we're starting to have some idea where we landed and what is happening in this function. In fact, we're getting really close! The last piece of the puzzle is going to come from the search phase.
Since the unwinding library is a generic language-independent algorithm, it knows how to walk up a stack but it doesn't actually know how to find any C++ catch blocks or destructors that need to be run. To do that, the compiler has to provide what's called a personality routine, which is going to be specific to the exception handling mechanism (and if you've ever had confusing link errors about __gxx_personality_v0, now you'll know that weird symbol is actually a personality routine, which has to match the exception-handling mechanism!).
Of course, everything I've described so far happens in the perfect abstract world of the Itanium specification, where our Sufficiently Smart Compilers provide modern, zero-cost, table-based exception handling. What makes those exception handling mechanisms so efficient is that they don't need to do anything at runtime as long as an exception isn't thrown. Instead, during the search phase the personality routine can get all the information it needs by looking up some tables embedded in the binary.
Back to SjLj, since it doesn't embed any tables the program has to re-create that same information at runtime, and compiler writers needed a way to shoehorn this old runtime system into the new world of fast inter-operable exceptions. They did that by introducing two new functions that the compiler would sprinkle throughout the code, to keep track of the entire context the search phase needs: _Unwind_SjLj_Register and _Unwind_SjLj_Unregister.
Denouement
And this is where everything starts to fall into place!
This SjLj context that needs to be maintained at runtime? That contains our stack pointer, saved by _Unwind_SjLj_Register at the start of every function that might need to run a destructor or catch an exception, and restored by the unwinder before any call to an exception handling landing-pad.
But our async code uses stackful coroutines! In other words, every coroutine has its own stack, and whenever tconcurrent switches coroutines the stack pointer is quietly updated by Boost Context's internal assembly routines — something that the compiler and the unwinder can't possibly know about.
So, we end up in a situation where _Unwind_SjLj_Register has saved a stack pointer and since then, we've switched to a completely different stack without updating SjLj's information. After a few coroutine switches, the chain of SjLj contexts that the Register/Unregister functions maintain has turned into a complete mess. (By contrast, other exception mechanisms don't need to save stack pointers or any other information at runtime, so they don't have an equivalent of the SjLj chain — nothing that needs updating.)
And finally, we can go back where we began: one of our Golang unit tests tries to exercise the error paths in our C++ library, resulting in a coroutine throwing an exception. The SjLj context chain — in complete disarray — causes destructors and other unwind code to run on the wrong stack during the cleanup phase, corrupting our saved context object for the tconcurrent event loop, which happens to fill it with zeros. Eventually tconcurrent's handler catches the exception — still on the wrong stack — and as it merrily resume normal execution, trying to switch back to the event loop, the program ends mysteriously with half its registers zeroed-out, flying off into the null address.
Still, some of you might be wondering, how did this ever work? How could the bug not trigger when the wrong kind of object is thrown, when some optimizations are disabled, or any other of a myriad of seemingly irrelevant details?
Fully explaining this is not necessary to understanding and fixing this bug, but I suspect the short answer is that this is largely due to the way the program is structured — all exceptions bubbling out of coroutines are caught in the same handler, which touches very little of the stack before switching back to the event loop's context and restoring everything saved inside. And so there is a large part of pure luck. If it just so happens that either the shuffled SjLj chain points to the right stack, or to the wrong stack but with enough buffer space to keep our saved event loop context out of harm's way, the bug will have trampled over only the stack of a terminating coroutine. If and when we manage to get back to the event loop, that coroutine's stack is never reused again, and the effect may just be invisible.
Conclusion
When faced with a bottomless rabbit-hole, jumping is rarely one's idea of a good time. In the worst of cases it can be tempting to settle for the first change that makes the problem disappear, to start reworking large chunks of code until the symptoms go away, or even to abandon entirely the feature causing all this trouble.
While it took the better part of a week to understand this bug, it's fair to say that we came away with a very simple diagnosis — the way our tconcurrent library uses Boost Context is incompatible with SjLj exceptions. And the cure is equally dull. We switched to Dwarf2 exceptions. But, having found the root cause, we can sleep soundly with the certainty that the bug is truly fixed, and having had the chance to learn a lot more than we bargained for!
No human is perfect, and no developer is either! As long as there is new code to write, new bugs will be written. But, at the end of the day, there is no substitute for understanding. So let's strive to learn from our errors, and make it our goal to ensure they only ever happen once.

Oldest comments (2)
I didn’t actually read the article 😌, I have 5 minutes to scan dev articles right this second.
But I wanted to say, LOvE the Headline ❤️
I loved this. As someone who has barely touched many of the tools you covered, you did a great job of breaking them down and making them understandable. Although I have to say, some alarm bells started ringing when I read "We developed our own low-level async solution"!
Well done, and thanks for taking the time to educate us. I think this might get more traction if it was broken up into two or even three parts - the attention span of the medium is pretty low. Again, though, I loved it.