
By: Matt McCormick  , Mary Elise Dedicke
  , Jean-Christophe Fillion-Robin , Will Schroeder
Effective debugging results in effective programming; itk-wasm makes effective debugging of WebAssembly possible. In this tutorial, adapted from the itk-wasm documentation, we walk through how to debug a C++ data processing pipeline with the mature, native binary debugging tools that are comfortable for developers. This is a fully featured way to ensure the base correctness of a processing pipeline. Next, we will walk through an interactive debugging experience for WASI WebAssembly. With itk-wasm, we can debug the same source code in either context with an interactive debugger. We also have a convenvient way to pass data from our local filesystem into a WebAssembly (Wasm) processing pipeline.
Let's get started! 🚀
0. Preliminaries
Before starting this tutorial, check out our Hello Wasm World tutorial.
1. Native Debugging
The tutorial code provides npm scripts as a convenient way to execute debugging commands, which you may also invoke directly in a command line shell.
#include <iostream>

int main() {
  std::cout << "Hello debugger world!" << std::endl;

  const char * wasmDetails = "are no longer hidden";

  const int a = 1;
  const int b = 2;
  const auto c = a + b;

  // Simulate a crash.
  abort();
  return 0;
}
To run these examples, first install and test Docker and Node/NPM. Then, install the package dependencies and run the example commands:
cd itk-wasm/examples/Debugging/
npm install
npm run <name>
where <name> is the npm script. Available names can be found by calling npm run without any arguments.
The CMake-based, itk-wasm build system tooling enables the same C++ build system configuration and code to be reused when building a native system binary or a WebAssembly binary. As a result, native binary debugging tools, such as GDB, LLDB, or the Visual Studio debugger can be utilized.
We can build the project's standard CMake build configuration,
cmake_minimum_required(VERSION 3.10)
project(DebuggingWebAssemblyExample)

add_executable(DebugMe DebugMe.cxx)
with standard CMake commands:

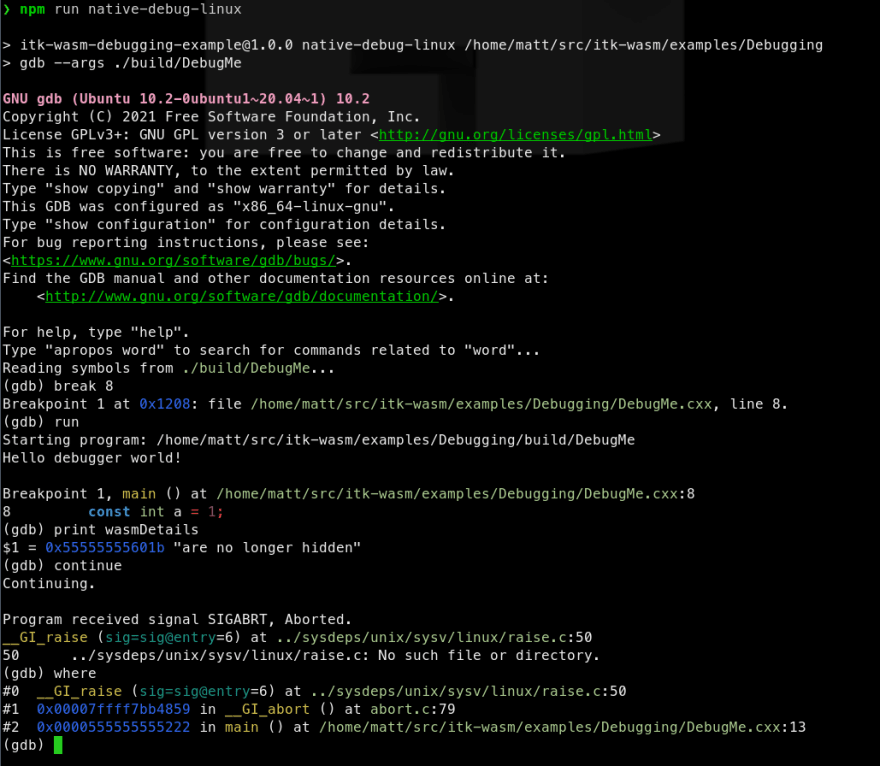
The native binary can then be debugged in the standard way. For example, with gdb on Linux:
2. WASI Debugging
The most direct way to debug WebAssembly is through the WebAssembly System Interface (WASI). In itk-wasm, we can build to WASI with the WASI SDK by specifying the itkwasm/wasi toolchain image. A backtrace can quickly be obtained with the itk-wasm CLI. Or, a fully fledged debugger session can be started with LLDB.
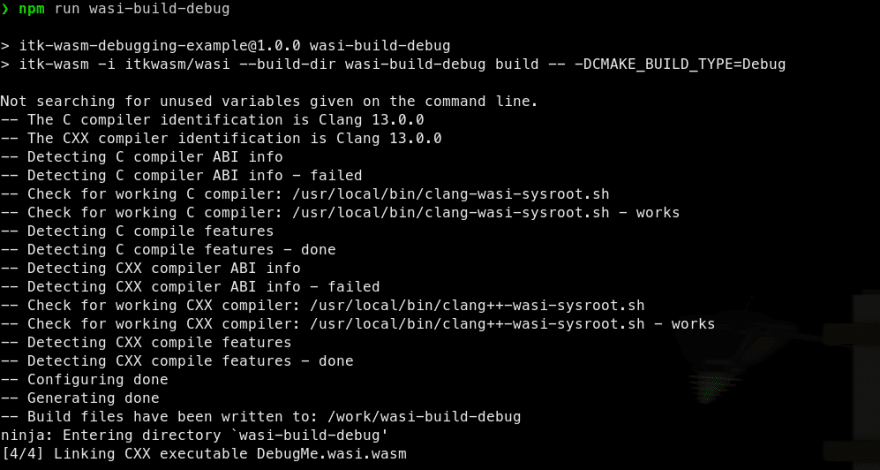
First, build to WASI WebAssembly with debugging symbols available:
Then, the itk-wasm CLI can conveniently run the Wasm binary with the included WASI runtime:

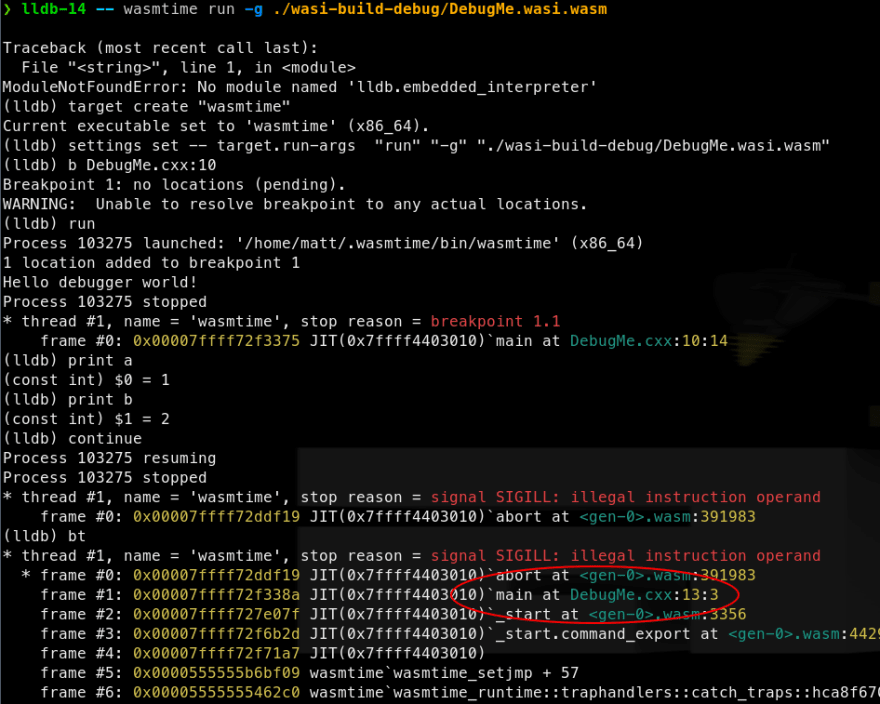
We can see that abort is called in the main function at line 13 in DebugMe.cxx.
A full debugging session is also possible after LLDB >= 13 and Wasmtime are installed.
What's Next
In our next post, we will provide a tutorial on how to debug C++ WebAssembly processing pipelines in a web browser.
Enjoy ITK!

Top comments (0)