
Welcome to the second part in the series about Debugging common .NET exceptions. The series is my attempt to demystify common exceptions as well as to provide actual help fixing each exception.
In this post, I take a look at one of the more tricky exceptions to fix: System.OutOfMemoryException. As the name suggests, the exception is thrown when a .NET application runs out of memory. There are a lot of blog posts out there, trying to explain why this exception occurs, but most of them are simply rewrites of the documentation on MSDN: System.OutOfMemoryException Class. In the MSDN article, two different causes of the OutOfMemoryException are presented:
Attempting to expand a StringBuilder object beyond the length defined by its StringBuilder.MaxCapacity property. This type of error typically has this message attached: "Insufficient memory to continue the execution of the program."
The common language runtime (CLR) cannot allocate enough contiguous memory.
In my past 13 years as a .NET developer, I haven't experienced the first problem, why I won't bother spending too much time on it. In short, doing something like this will cause a System.OutOfMemoryException:
StringBuilder sb = new StringBuilder(1, 1);
sb.Insert(0, "x", 2);
Why? Well, we define a new StringBuilder with a max capacity of one character and then try to insert two characters.
With that out of the way, let's talk about why you are probably experiencing the exception: because the CLR cannot allocate the memory that your program is requesting. To translate this into something that your Mom would understand, your application is using more resources than available.
.NET programs often use a lot of memory. The memory management in .NET is based on garbage collection, which means that you don't need to tell the framework when to clean up. When .NET detects that an object is no longer needed, it is marked for deletion and deleted next time the garbage collector is running. This also means that an OutOfMemoryException doesn't always equal a problem. 32-bit processes have 2 GB of virtual memory available, and 64-bit processes have up to 8 TB. Always make sure to compile your app to 64-bit if running on a 64-bit OS (it probably does that already). If you're interested in more details about this subject, I recommend this article from Eric Lippert, a former Microsoft employee working on the C# compiler: “Out Of Memory” Does Not Refer to Physical Memory. It's important to distinguish between heavy memory usage and a memory leak. The first scenario can be acceptable, while the second always requires debugging.
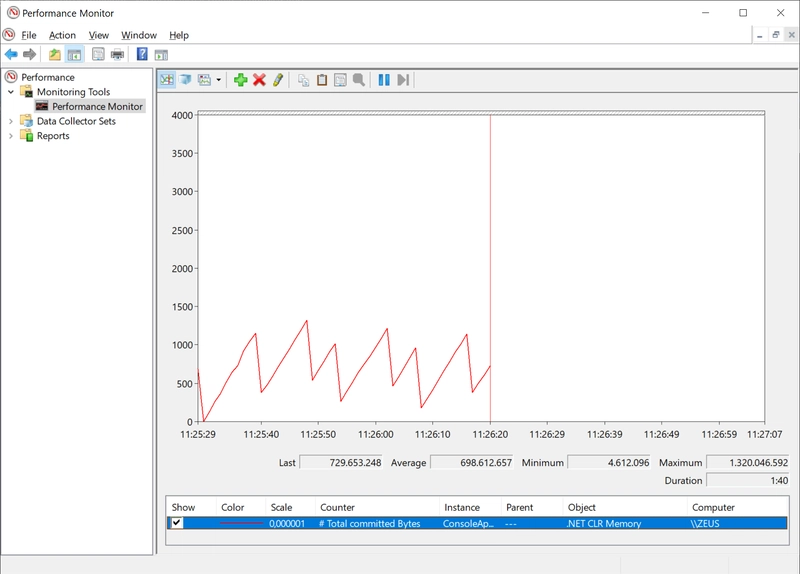
To start debugging the OutOfMemoryException, I recommend you to look at your application either through the Task Manager or using perfmon.msc. Both tools can track the current memory consumption, but to get a better overview over time, perfmon is the best. When launched, right-click the graph area and click Add Counters... Expand the .NET CLR Memory node and click # Total committed Bytes. Finally, select the process you want to monitor in the Instances of selected object list and click the OK button.
For the rest of this post, I will use and modify a sample program, adding strings to a list:
class Program
{
    static void Main(string[] args)
    {
        try
        {
            var list = new List<string>();
            int counter = 0;
            while (true)
            {
                list.Add(Guid.NewGuid().ToString());
                counter++;
                if (counter%10000000 == 0)
                {
                    list.Clear();
                }

            }
        }
        catch (OutOfMemoryException e)
        {
            Environment.FailFast(String.Format($"Out of Memory: {e.Message}"));
        }
    }
}
In its current state, the program keeps adding strings to a list and every 10,000,000 times clear the list. When looking at the current memory usage in Perfmon, you'll see the current picture:
Garbage collection at its finest. Here, I've removed the call to list.Clear():
class Program
{
    static void Main(string[] args)
    {
        try
        {
            var list = new List<string>();
            while (true)
            {
                list.Add(Guid.NewGuid().ToString());
            }
        }
        catch (OutOfMemoryException e)
        {
            Environment.FailFast(String.Format($"Out of Memory: {e.Message}"));
        }
    }
}
We now get a completely other picture:

The program keeps allocating memory, until a System.OutOfMemoryException is thrown.
The example illustrates how you can utilize Perfmon to monitor the state of your application. Like the chefs on TV, I cheated and made up an example for this post. In your case, you probably have no clue to what causes the extensive use of memory. Memory profilers to the rescue!
Unlike Task Manager and Perfmon, memory profilers are tools to help you find the root cause of a memory problem or memory leak. There a lot of useful tools out there like JetBrains dotMemory and ANTS Memory Profiler. For this post, I'll use .NET Memory Profiler, which I have used heavily in the past. BTW, as an elmah.io customer, you will get a 20% discount on .NET Memory Profiler.
.NET Memory Profiler integrates nicely into Visual Studio, why profiling your application is available by clicking the new Profiler > Start Memory Profiler menu item. Running our sample from previously, we see a picture similar to that of Perfmon:

The picture looks pretty much like before. The process allocates more and more memory (the orange and red lines), and the process throws an exception. In the bottom, all objects allocated from the profiling sessions are shown and ordered allocations. Looking at the top rows is a good indicator of what is causing a leak.
In the simple example, it's obvious that the strings added to the list if the problem. But most programs are more complex than just adding random strings to a list. This is where the snapshot feature available in .NET Memory Profiler (and other tools as well) shows its benefits. Snapshots are like restore points in Windows, a complete picture of the current memory usage. By clicking the Collect snapshot button while the process is running, you get a diff:

Looking at the Live Instances > New column, it's clear that someone is creating a lot of strings.
I don't want this to be an ad for .NET Memory Profiler, so check out their documentation for the full picture of how to profile memory in your .NET programs. Also, make sure to check out the alternative products mentioned above. All of them have free trials, so try them out and pick your favorite.
I hope that this post has provided you with "a very particular set of skills" (sorry) to help you debug memory issues. Unfortunately, locating memory leaks can be extremely hard and requires some training and experience.
Also make sure to read the other posts in this series: Debugging common .NET exception.
Would your users appreciate fewer errors?
elmah.io is the easy error logging and uptime monitoring service for .NET. Take back control of your errors with support for all .NET web and logging frameworks.
➡️ Error Monitoring for .NET Web Applications ⬅️
This article first appeared on the elmah.io blog at https://blog.elmah.io/debugging-system-outofmemoryexception-using-net-tools/

Top comments (0)