
PromQL is a built in query-language made for Prometheus. Here at Timber we've found Prometheus to be awesome, but PromQL difficult to wrap our heads around. This is our attempt to change that.

Basics
Instant Vectors
Only Instant Vectors can be graphed.
http_requests_total
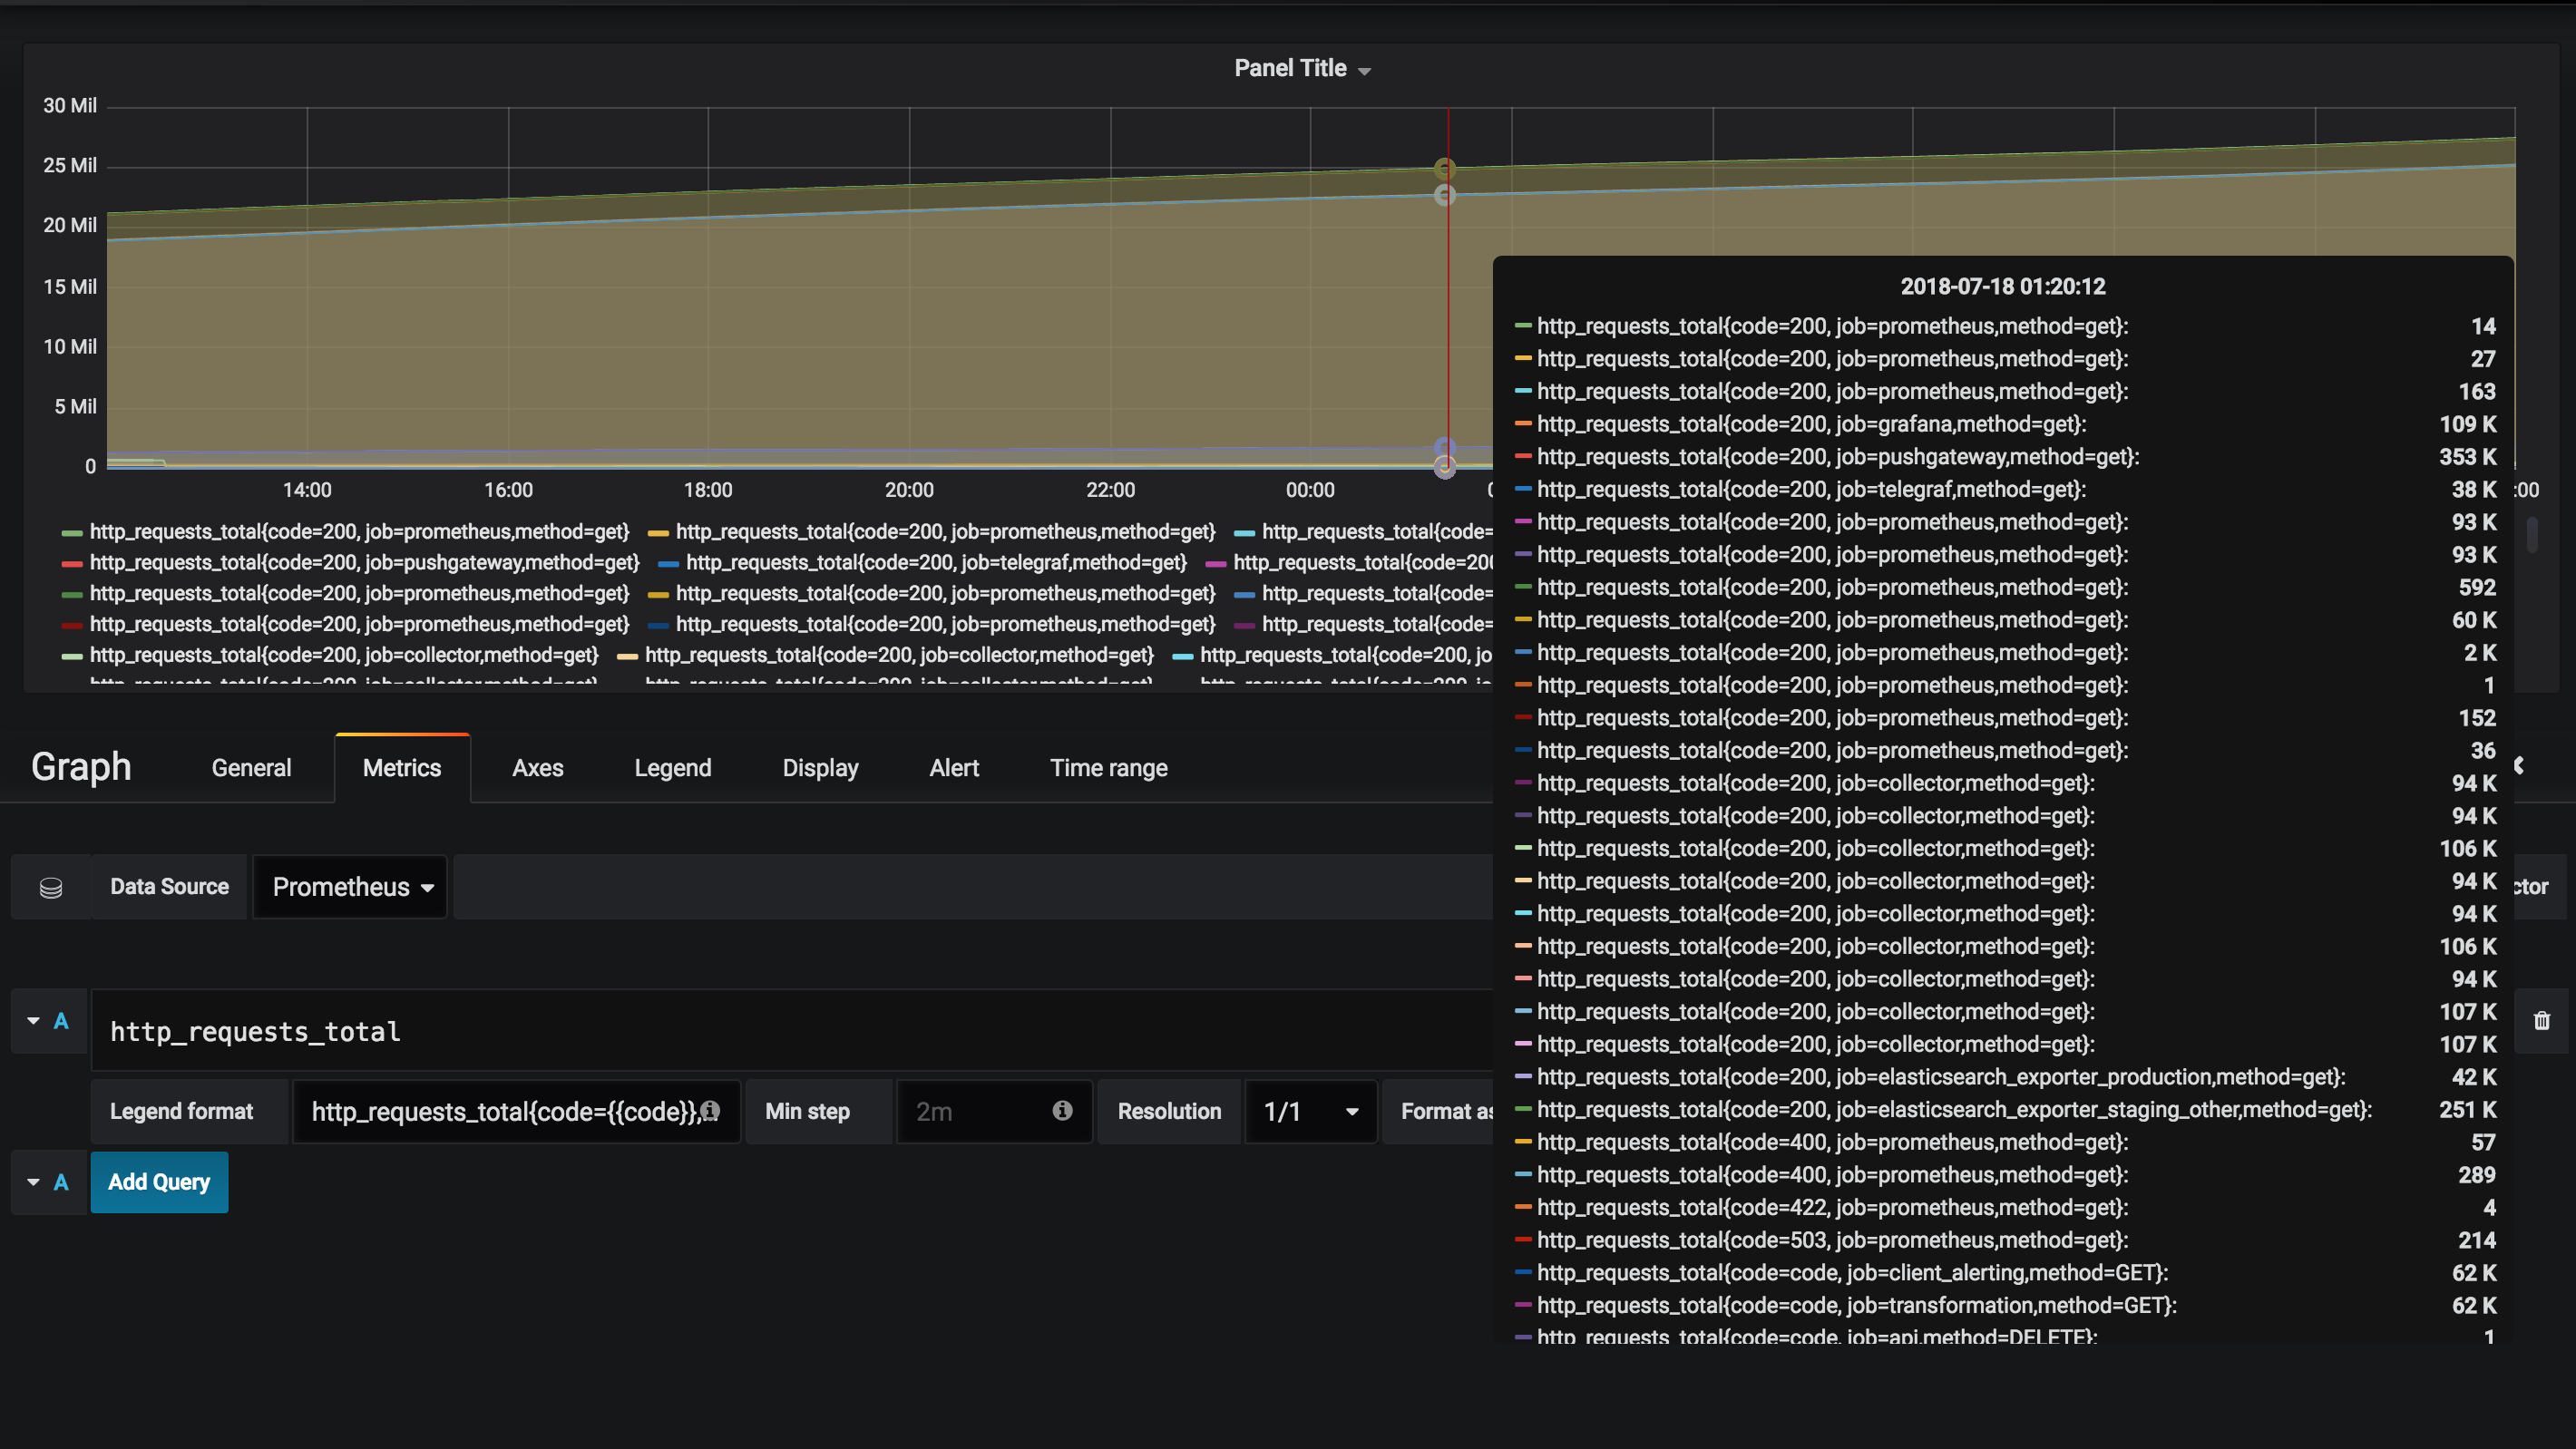
This gives us all the http requests, but we've got 2 issues.
- There are too many data points to decipher what's going on.
- You'll notice that
http_requests_totalonly goes up, because it's a counter. These are common in Prometheus, but not useful to graph.
I'll show you how to approach both.
It's easy to filter by label.
http_requests_total{job="prometheus", code="200"}

You can check a substring using regex matching.
http_requests_total{status_code=~"2.*"}

If you're interested in learning more, here are the docs on Regex.
Range Vectors
Contain data going back in time.
Recall: Only Instant Vectors can be graphed. You'll soon be able to see how to visualize Range Vectors using functions.
http_requests_total[5m]
You can also use (s, m, h, d, w, y) to represent (seconds, minutes, hours, ...) respectively.
Important functions
For Range Vectors
You'll notice that we're able to graph all these functions. Since only Instant Vectors can be graphed, they take a Range Vector as a parameter and return a Instant Vector.
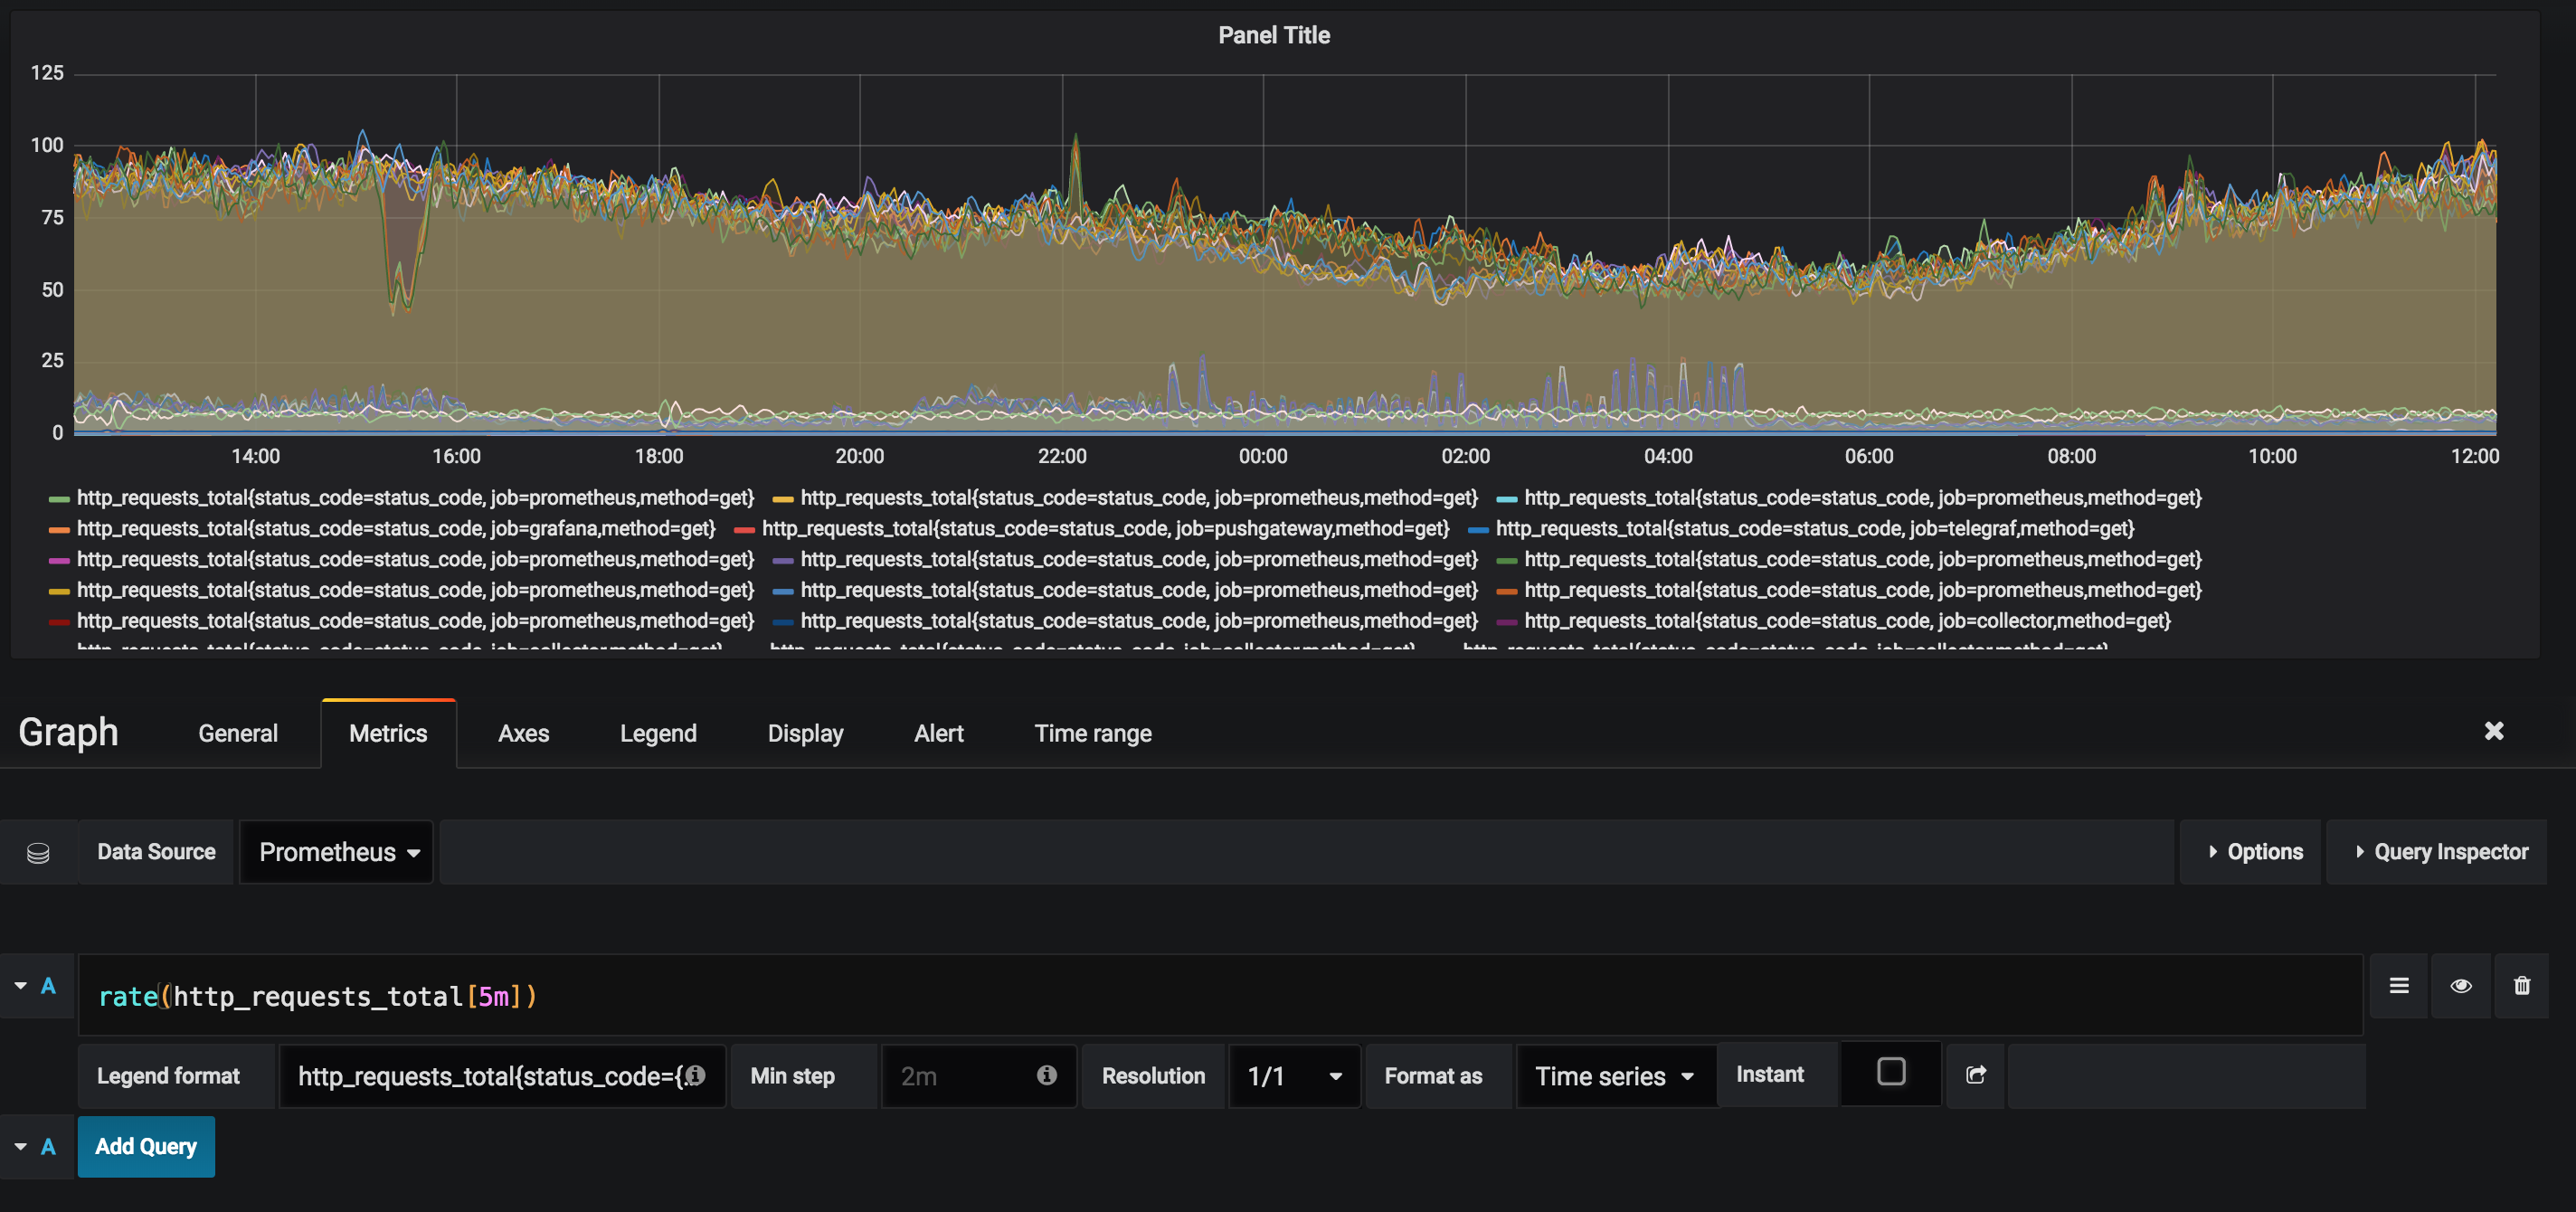
Increase of http_requests_total averaged over the last 5 minutes.
rate(http_requests_total[5m])
Irate
Looks at the 2 most recent samples (up to 5 minutes in the past), rather than averaging like rate
irate(http_requests_total[5m])
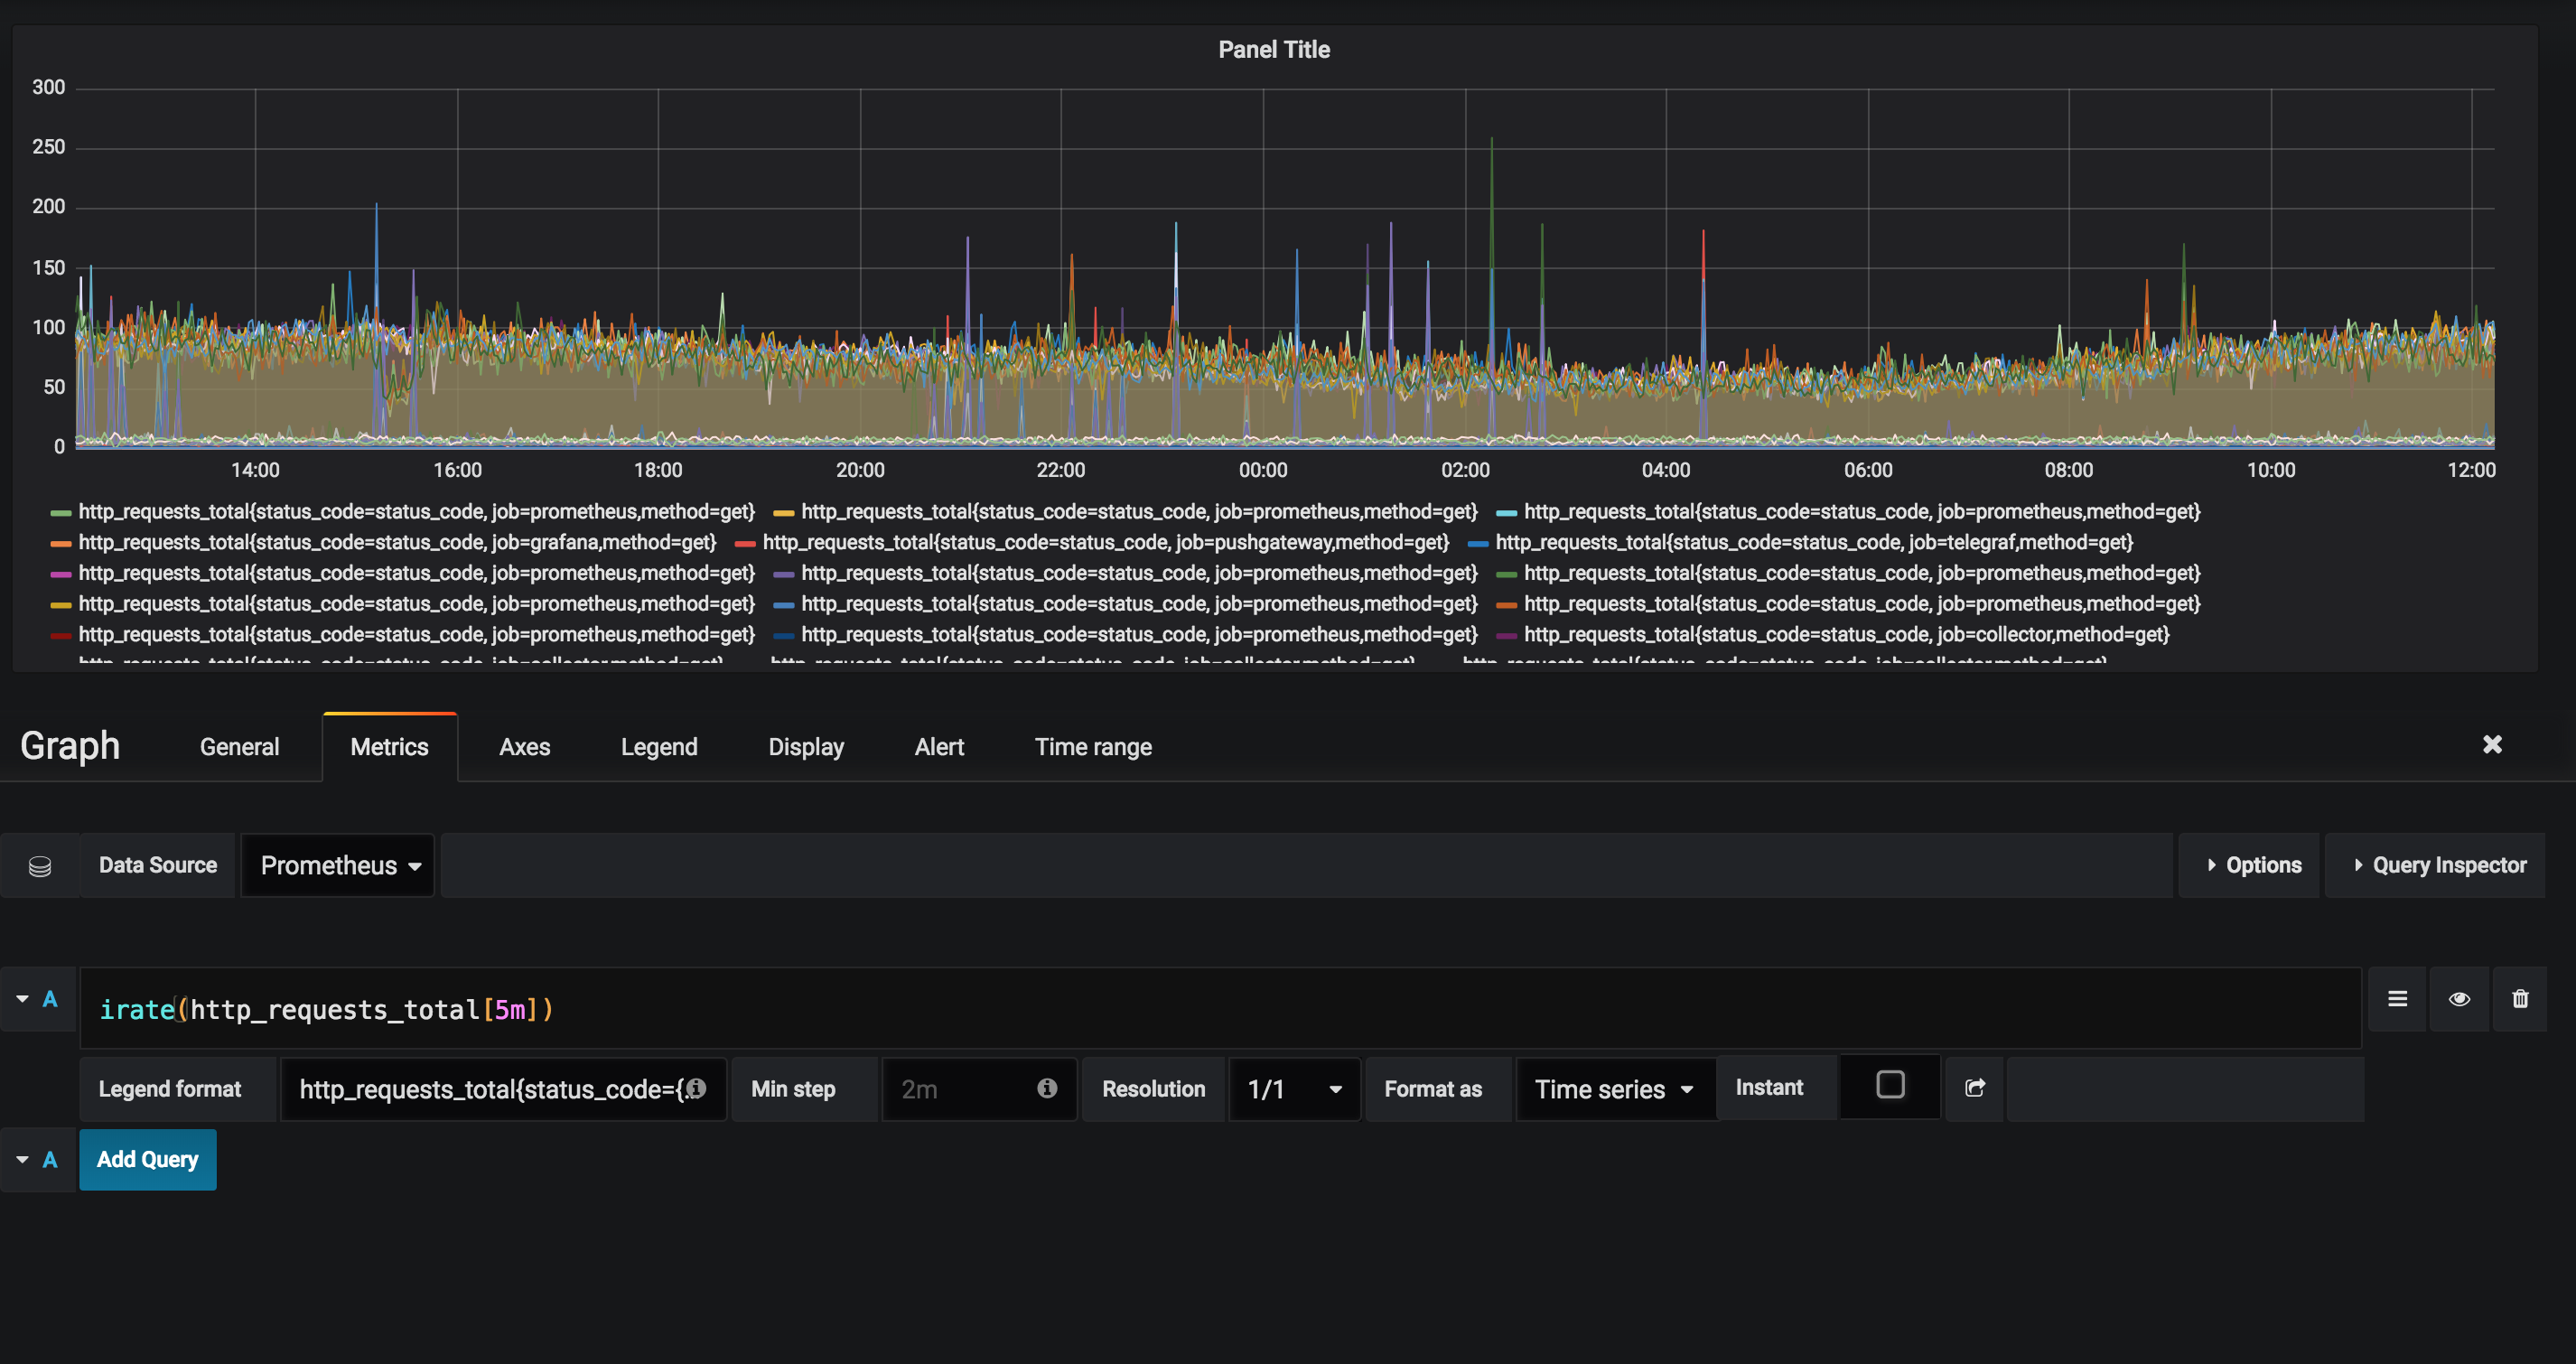
It's best to use rate when alerting, because it creates a smooth graph since the data is averaged over a period of time. Spikey graphs can cause alert overload, fatigue, and bad times for all due to repeatedly triggering thresholds.
HTTP Requests in the last hour.
This is equal to the rate * # of seconds
increase(http_requests_total[1h])

These are a small fraction of the functions, just what we found most popular. You can find the rest here.
For Instant Vectors
Broken by Status Code
sum(rate(http_requests_total[5m]))
You'll notice that rate(http_requests_total[5m]) above provides a large amount of data. You can filter that data using your labels, but you can also look at your system as a whole using sum (or do both).
You can also use min, max, avg, count, and quantile similarly.

This query tells you how many total HTTP requests there are, but isn't directly useful in deciphering issues in your system. I'll show you some functions that allow you to gain insight into your system.
Sum by Status Code
sum by (status_code) (rate(http_requests_total[5m]))
You can also use without rather than by to sum on everything not passed as a parameter to without.
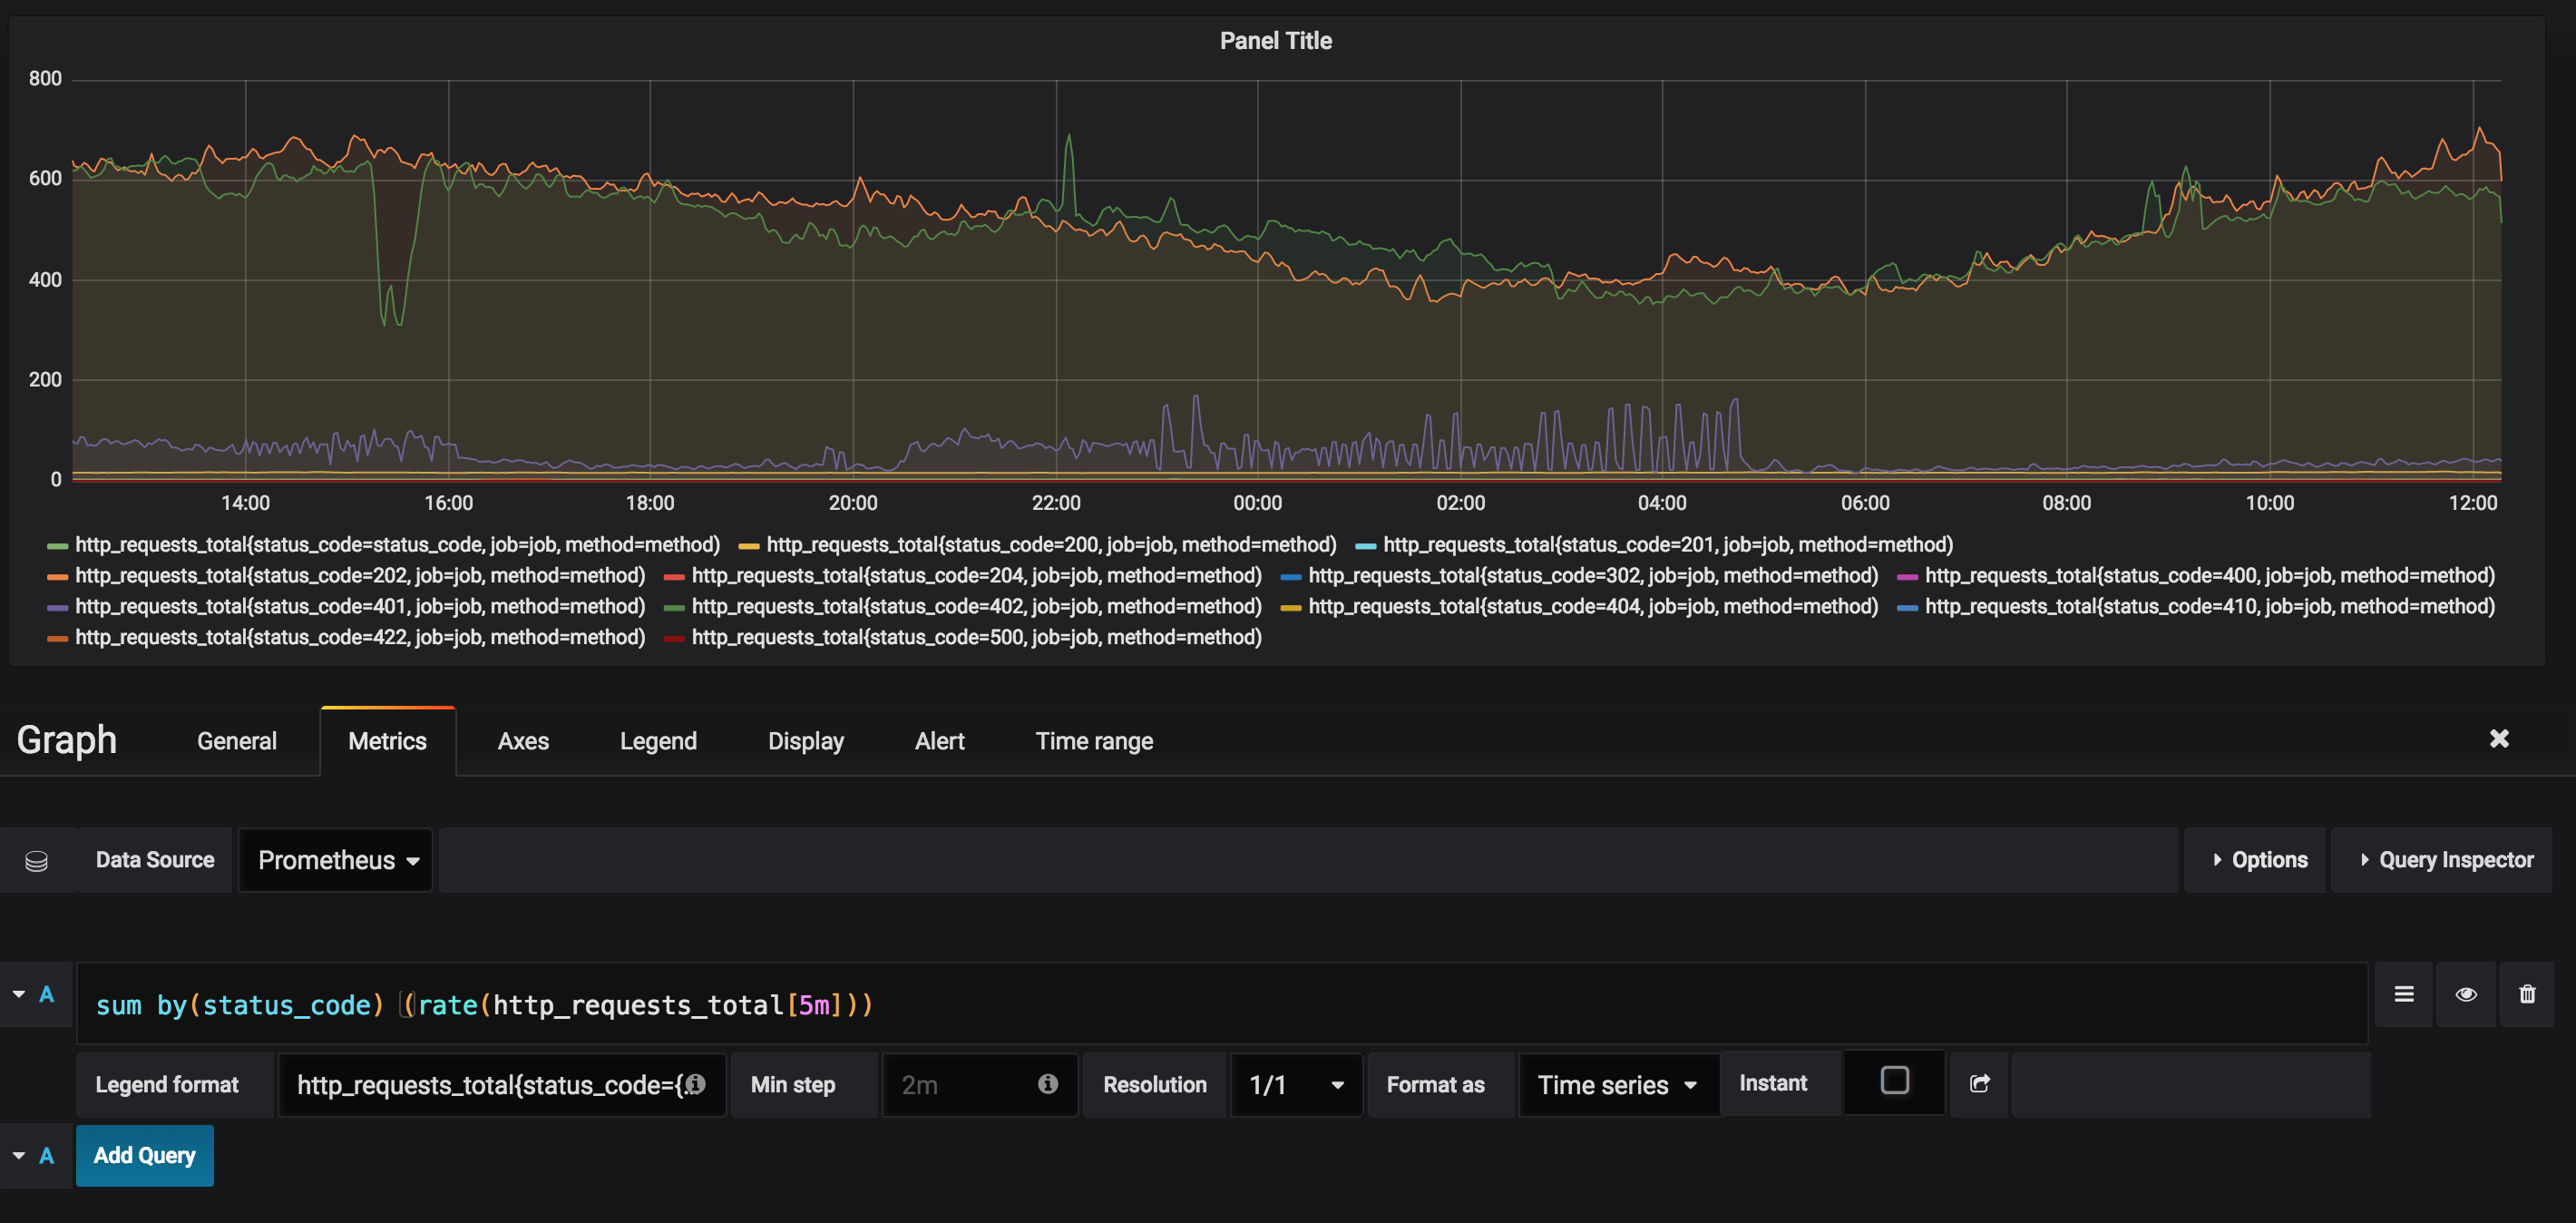
Now, you can see the difference between each status code.
Offset
You can use offset to change the time for Instant and Range Vectors. This can be helpful for comparing current usage to past usage when determining the conditions of an alert.
sum(rate(http_requests_total[5m] offset 5m))
Remember to put offset directly after the selector.
Operators
Operators can be used between scalars, vectors, or a mix of the two. Operations between vectors expect to find matching elements for each side (also known as one-to-one matching), unless otherwise specified.
There are Arithmetic (+, -, *, /, %, ^), Comparison (==, !=, >, <, >=, <=) and Logical (and, or, unless) operators.
Vector Matching
One-to-One
Vectors are equal i.f.f. the labels are equal.
API 5xxs are 10% of HTTP Requests
rate(http_requests_total{status_code=~"5.*"}[5m]) > .1 * rate(http_requests_total[5m])
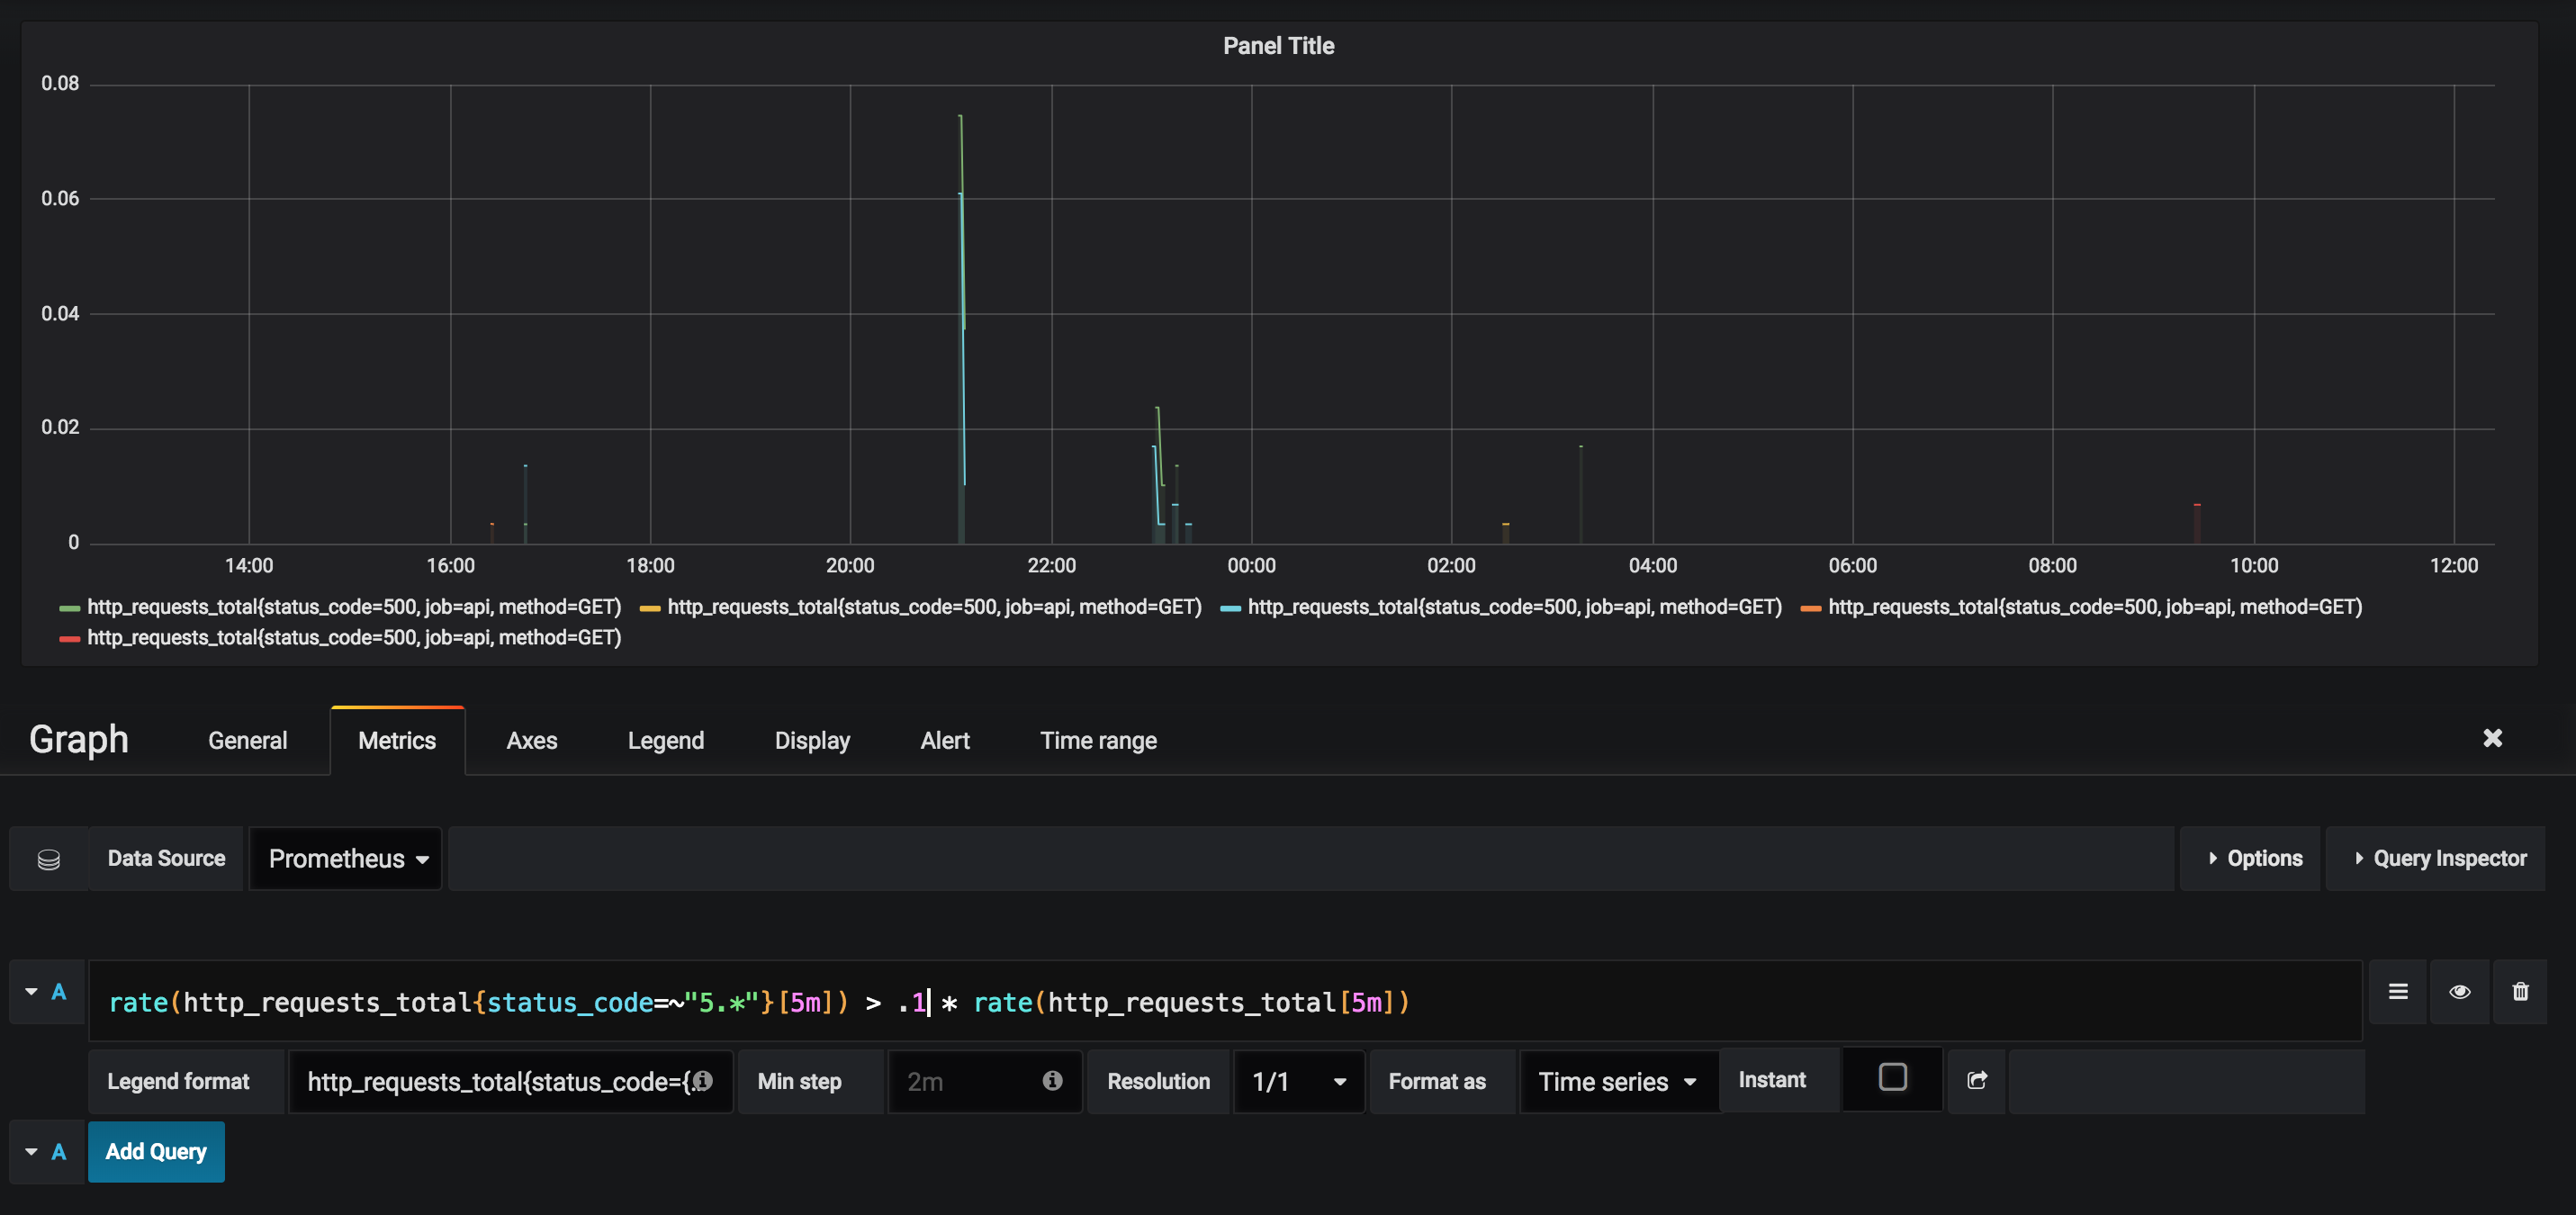
We're looking to graph whenever more than 10% of an instance's HTTP requests are errors. Before comparing rates, PromQL first checks to make sure that the vector's labels are equal.
You can use on to compare using certain labels or ignoring to compare on all labels except.
Many-to-One
It's possible to use comparison and arithmetic operations where an element on one side can be matched with many elements on the other side. You must explicitly tell Prometheus what to do with the extra dimensions.
You can use group_left if the left side has a higher cardinality, else use group_right.
Examples
Disclaimer: We've hidden some of the information in the pictures using the Legend Format for privacy reasons.
CPU Usage by Instance
100 * (1 - avg by(instance)(irate(node_cpu{mode='idle'}[5m])))
Average CPU Usage per instance for a 5 minute window.

Memory Usage
node_memory_Active / on (instance) node_memory_MemTotal
Percentage of memory being used by instance.

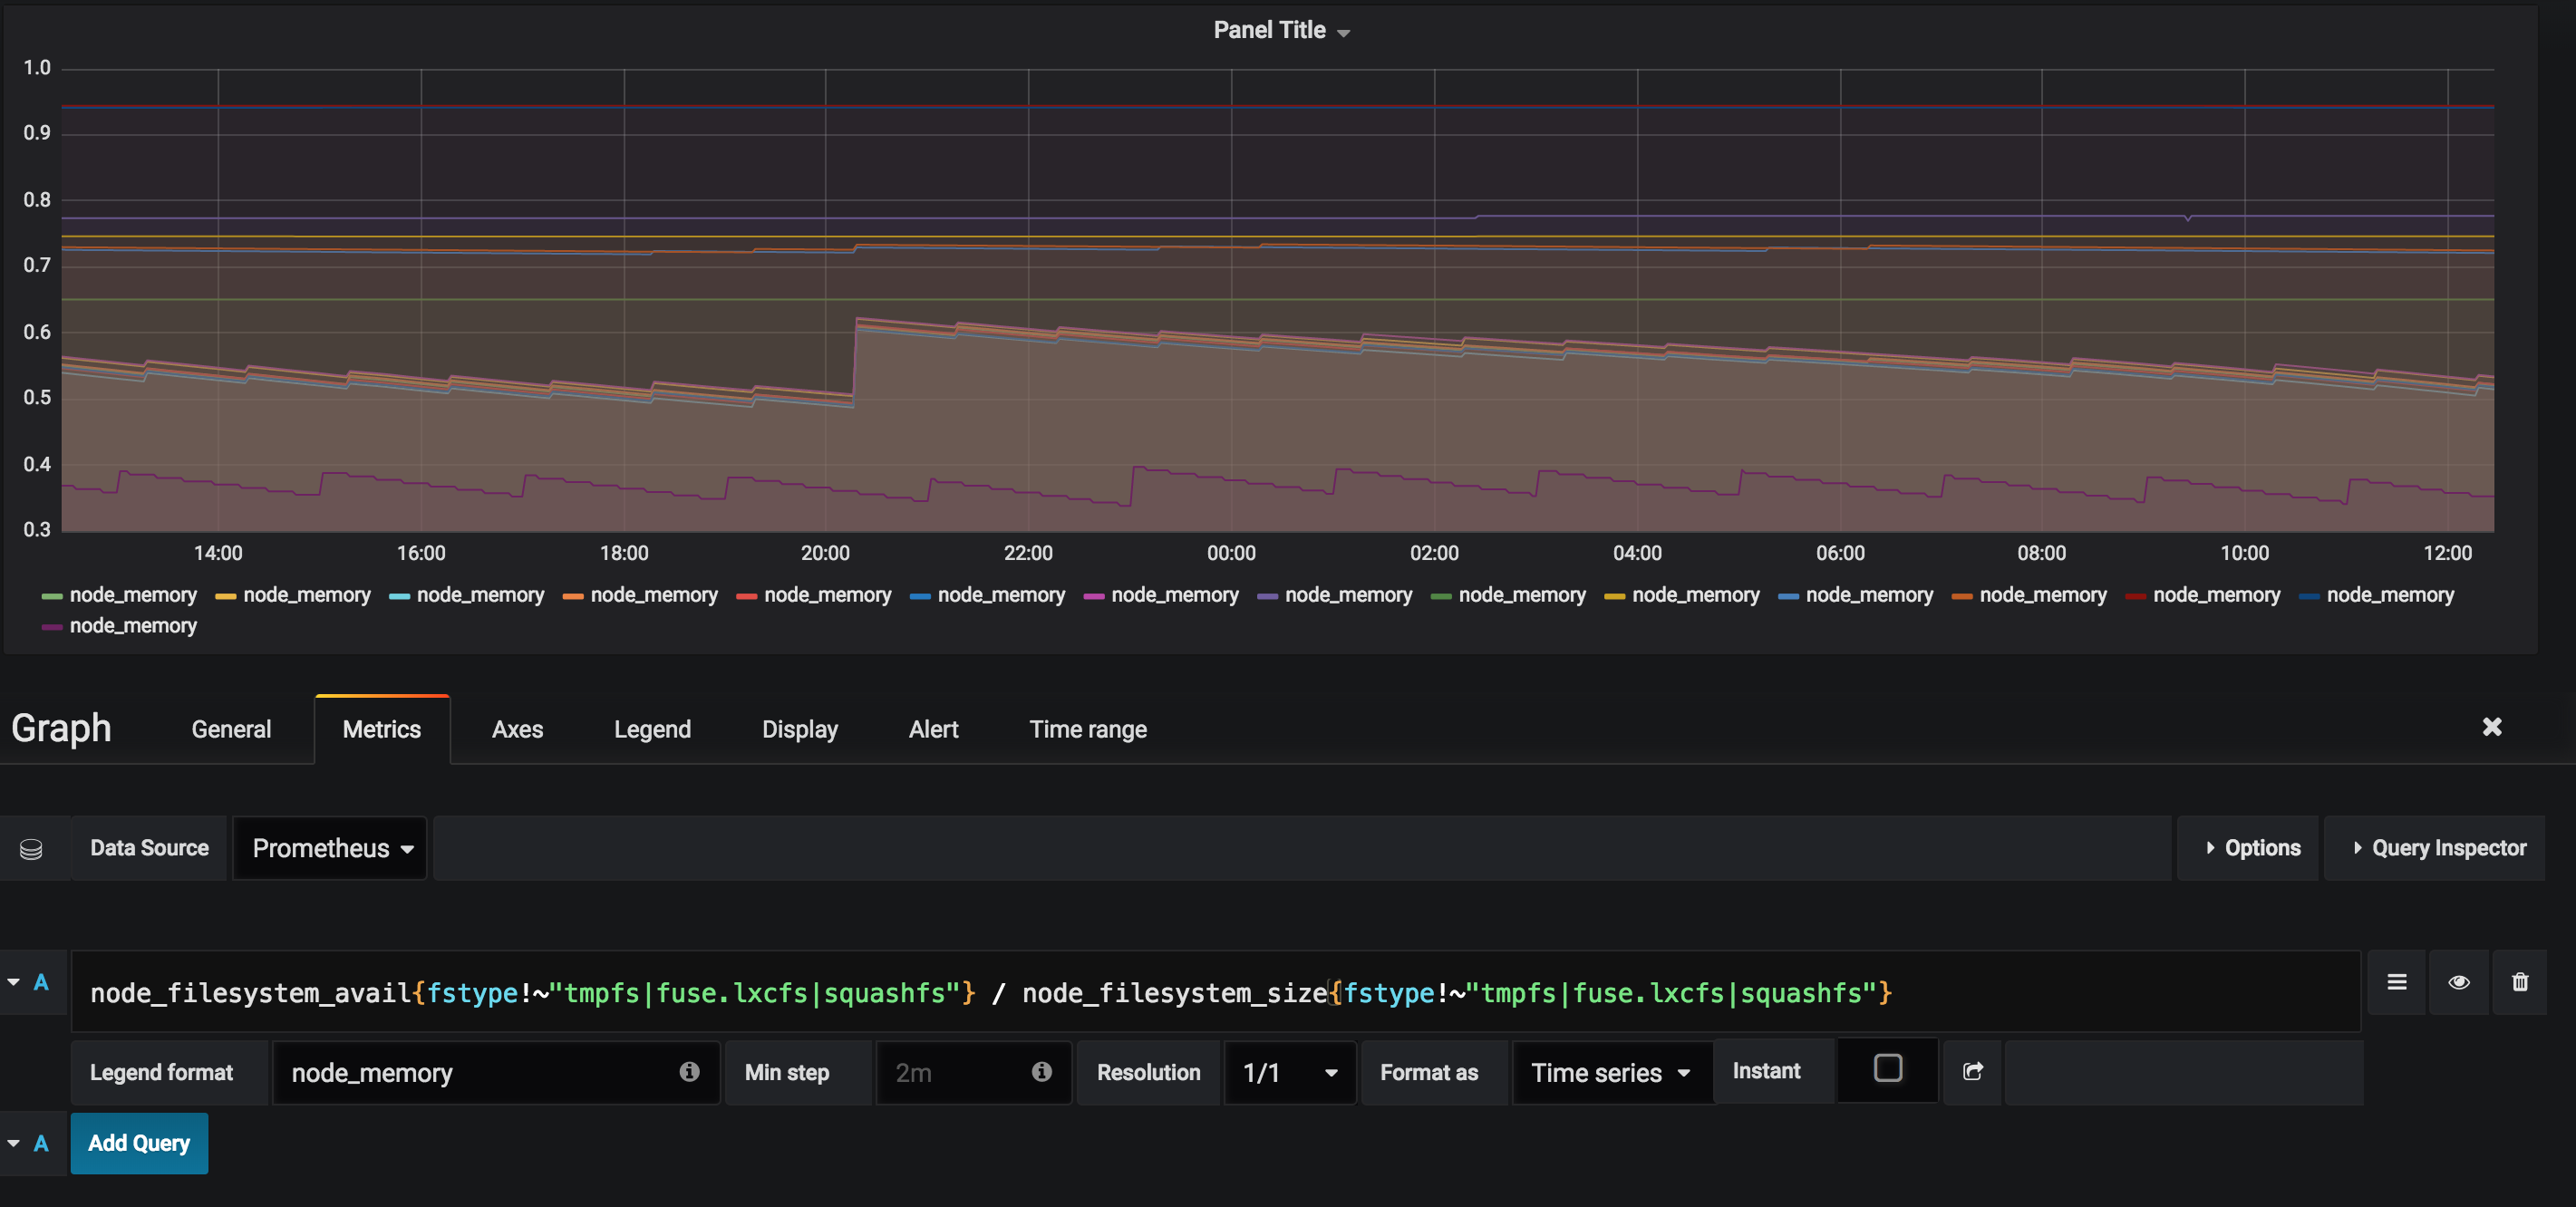
Disk Space
node_filesystem_avail{fstype!~"tmpfs|fuse.lxcfs|squashfs"} / node_filesystem_size{fstype!~"tmpfs|fuse.lxcfs|squashfs"}
Percentage of disk space being used by instance. We're looking for the available space, ignoring instances that have tmpfs, fuse.lxcfs, or squashfs in their fstype and dividing that by their total size.
HTTP Error Rates as a % of Traffic
rate(http_requests_total{status_code=~"5.*"}[5m]) / rate(http_requests_total[5m])

Alerts Firing in the last 24 hours
sum(sort_desc(sum_over_time(ALERTS{alertstate="firing"}[24h]))) by (alertname)

You can find more useful examples here.
3 Pillars of Observability
It's important to understand where metrics fit in when it comes to observing your application. I recommend you take a look at the 3 pillars of observability principle. Metrics are an important part of your observability stack, but logs and tracing are equally so.
We're a cloud-based logging company at Timber that seamlessly augments your logs with context. We've got a great product built, and you can check it out for free!


Latest comments (0)