As a Senior QA Automation professional at Luxoft, I have had the opportunity to work extensively on projects using listeners in JMeter. I aim to provide beginners and individuals seeking a deeper understanding with valuable insights into leveraging listeners in JMeter.
Listener allows us to view and analyze the Sampler request and response in the form of tables, graphs, trees etc. You can also save results in a file and read saved results later. You can access the sampler result in an ongoing load/stress test without waiting till end.
A listener can be added anywhere in the test plan e.g under thread group or sampler based on test scenarios. It will gather data only from elements defined in its scope and create a report/graph based on that. All listeners use the same data and result for generating the report/graph only difference is the visualization or the way the represent on GUI .
The list of listeners is as follows:
Aggregate Graph
Aggregate Report
Assertion Results
Backend Listener
BeanShell Listener
BSF Listener
Comparison Assertion Visualizer
Generate Summary Results
Graph Results
JSR223 Listener
Mailer Visualizer
Monitor Results
Response Time Graph
Saves Responses to a file
Simple Data Writer
Summary Report
View Results in Table
View Results Tree
Most popular listeners are
–Graph Results
–View Result Tree
Let’s have a look at some common types of Listeners, before that lets setup basic test plan for all listernsers .
First, we need to create a Test Plan in JMeter. Now add the Thread Group inside the Test Plan.
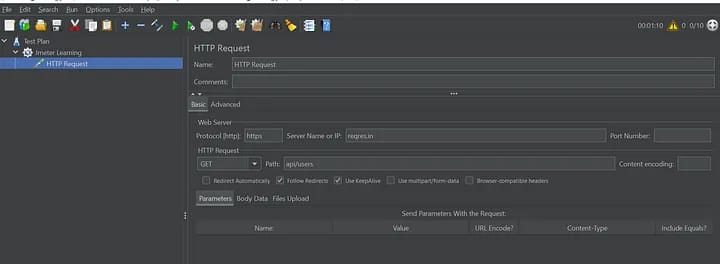
After creating Thread now we need to add the sampler, here we added an HTTP request sampler as shown in the following screenshot as follows.
Provide protocal as “https” .
Server Name as “reqres.in” — dummy API end point .
Http request as “GET” .
Path as “api/users” .
As mentioned previously listener can be placed anywhere or at any level
Test plan level
Test plan level listener scope is throughout the test plan. this listener will be for all thread groups as well as for all sampler requests.
- Thread group level :
Thread group level listener scope is throughout specific thread group where it is added. This listener will be for a specific thread group as well as for all sampler requests under that thread group.
- Sampler level
Sampler-level listener scope is throughout specific sampler requests where it is added. This listener will be for a specific sampler request only.

View Report Tree:
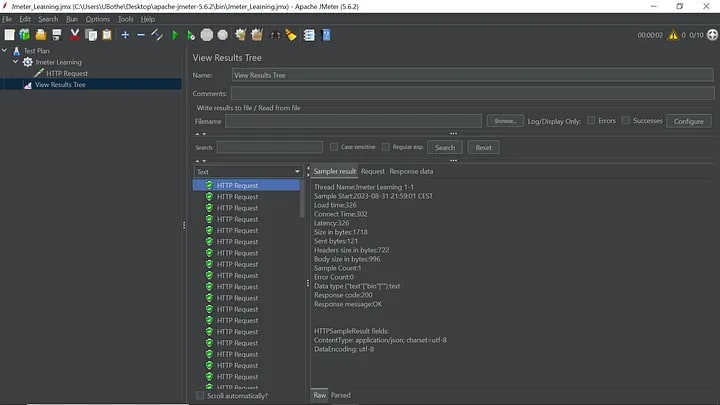
View Results Tree displays a tree consisting of all the Sampler responses along with their requests.
Please Note that the View Results Tree should not be used during the Load/Stress test as it consumes a lot of resources like memory and CPU. It is recommended to use it for functional testing or debugging purposes.
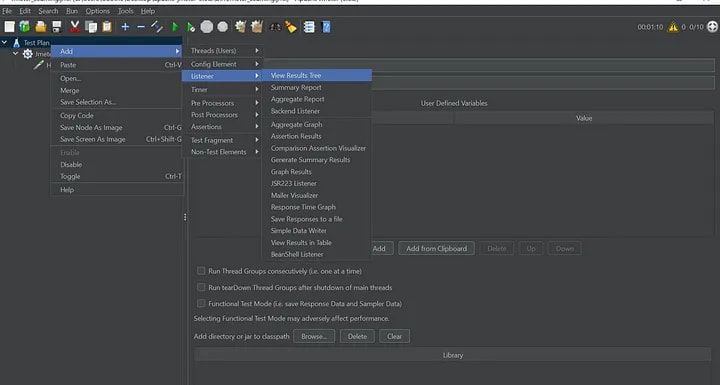
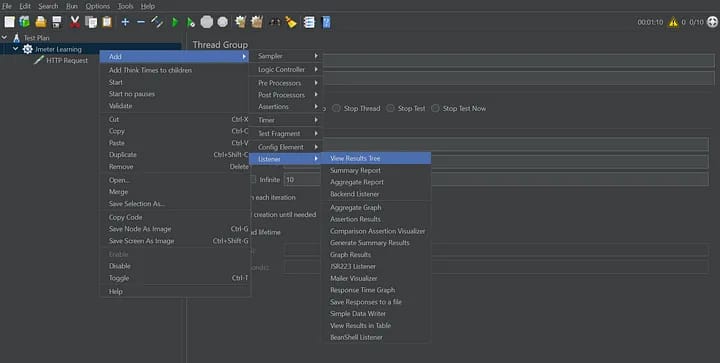
Add View Report : Go to test plan > right click > Add > Listener > View Result Tree

Run the test plan to see View Result report .
Imagine you’re running a race with multiple checkpoints. Each checkpoint represents a different action your computer is simulating, like sending a request to a website. The “View Results in Table” listener is like a scorecard that keeps track of how well each action performs.
Here’s what you’ll see in this scorecard:
Sample Number: This is like the order in which the actions were performed, so you know which one happened first, second, and so on.
Thread Name: Think of this as the name of the player (or runner) performing the actions. It helps you know which part of your test is responsible for each action.
Sample Label: Just like giving a name to each checkpoint, this label tells you what kind of action was performed, such as visiting a certain web page.
Sample Time: This is how long it took for that specific action to finish, from start to finish.
Start Time: When the action was started.
Load Time: The time the server took to do its work and send back the response.
Latency: Time between when you start and when you got the first response.
Idle Time: waiting timing for the response once action is finished
Sample Count: count of samples or no of threads
Error Count: The number of times the action ran into a problem.
Summary Report :
The summary report creates a table row for each differently named request in your test.
run the test plan and get the summary report as below based on sampler name

Label ::Label is created based on sampler name e.g HTTP Request 1 and HTTP Request 2 . If the sampler names are similar then request 1 result will append the request 2 results instead of created two different labels .
Samples : No of thread denotes number of sampler for the sampler request .
samples= No of threads * loop count = 10*10 =100 samples
Average: It gives the time for avg samplers to execute the test plan
Min: It gives the minimum value a sampler request has taken to complete out during the execution of the sampler based on loop and thread count. ( out of 100 samplers)
Max: It gives the maximum value a sampler request has taken to complete out during the execution of the sampler based on loop and thread count. ( out of 100 samplers)
Std Dev : The “Std. Dev.” column provides an indication of how much individual response times deviate from the average
Error %: This column will give you error percentage
Throughput : Throughput measures how many actions a system can handle in a given time, indicating its processing capacity in performance testing
Received KB/sec: This measures the rate at which data (in kilobytes) is received by the system from external sources (like users or servers) per second. It reflects how quickly the system is getting data from outside.
Sent KB/sec: This measures the rate at which data (in kilobytes) is sent from the system to external destinations (like users or servers) per second. It indicates how fast the system is sending out data.
Avg Bytes : This stands for “Average Bytes.” It’s the average amount of data (in bytes) transferred in each request or response between the system and external sources. It helps understand the typical data size being exchanged
Aggregate Report
Aggregate report shows a separate table row for each differently named sampler request in the test.

Run the Test plan

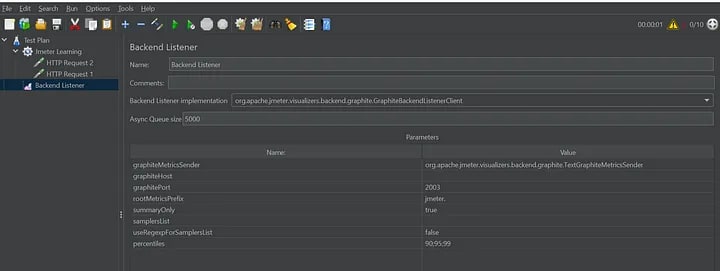
Backend Listener
The “Backend Listener” in JMeter is like a messenger that sends test performance data to a special place for better understanding, similar to sharing race statistics with a friend who records them.
So, the “Backend Listener” is like your helper to get the test results to a place where you can easily see how your application is handling things, just like your friend helps you keep track of how fast a car goes during a race.
Aggregate Graphs:
Aggregate graphs allow us to generate bar graphs easily and let us select graph display settings. The generated graph and table data can be saved explicitly in the form of PNG and CSV.

Assertion Results:
Assertion Results displays the results of assertions applied on the Sampler. You can see in the below figure, if any assertion fails it will look like this.
Please Note that Assertion Results SHOULD NOT BE USED during Load/Stress test as it consumes a lot of resources like memory and CPU. It is recommended to use it with functional testing or debugging purposes.
To add the assertion where we are asserting response code =400 if not then sampler should be failed
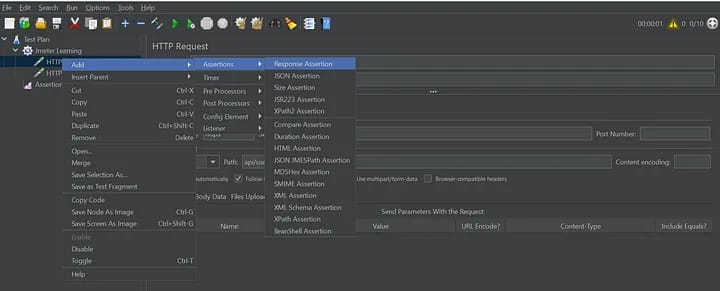
Response assertion or any assertion can be at any level .
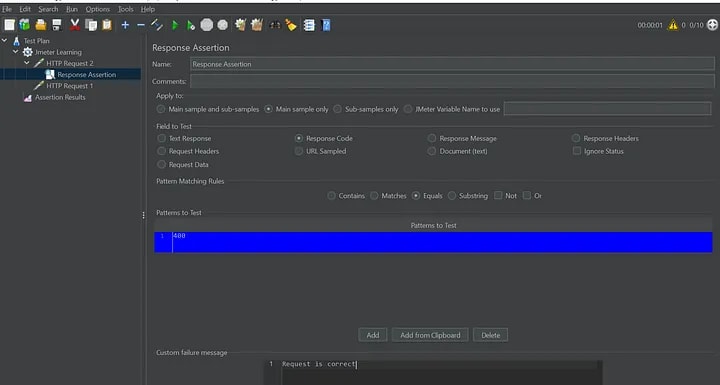
If the sampler is failed then you will sampler name followed by a failure message else sampler name only .

Comparison Assertion Visualizer
The “Comparison Assertion Visualizer” in JMeter allows you to compare the responses of two or more requests during a performance test, helping you identify differences and inconsistencies between them. It’s like having a tool that highlights variations in how different parts of your application respond under load.

Generate Summary Results
“Generate Summary Results” in JMeter refers to the process of creating a summarized report that provides key performance metrics from a test run. It’s like creating a condensed overview of how well your application performed under specific conditions, offering insights into response times, throughput, error rates, and other important data points.

Rest listener will be covered in next article .
Happy Reading !!

Top comments (0)