
In this tutorial I'm going to teach you how to debug PHP using VS Code Debugger with simple steps.
1. PHP Debug extension
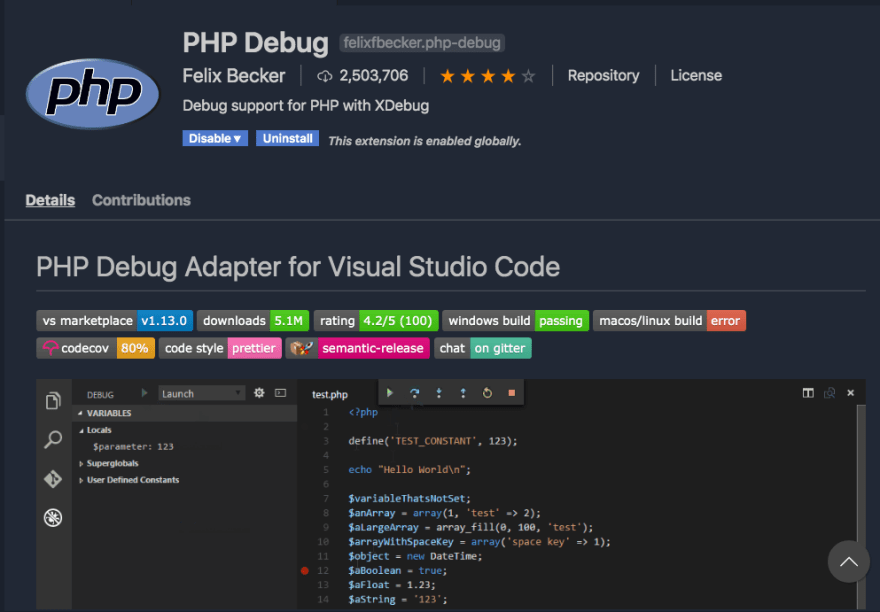
First of all we need to know we have to install an extension to be able to activate the PHP debugger in VS Code. The recommended extension is called PHP Debug. Something we need to notice is that this extension needs Xdebug to work.
2. Xdebug Installation
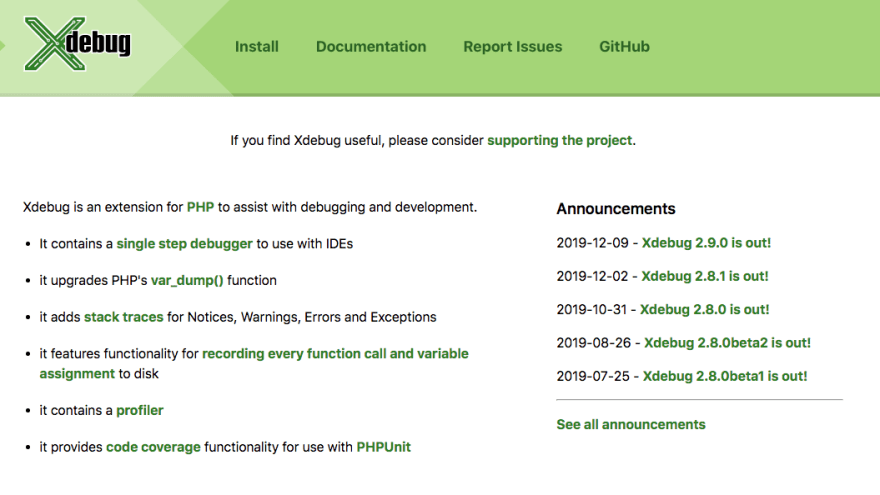
Xdebug is a PHP extension which provides debugging and profiling capabilities. It uses the DBGp debugging protocol. At this end this tool is responsible to enable the debugging on PHP, and Xcode takes advantage of it.
The debug information that Xdebug can provide includes the following:
- Stack and function traces in error messages with:
- Full parameter display for user defined functions
- Function name, file name and line indications
- Support for member functions
- Memory allocation
- Protection for infinite recursions
Xdebug also provides:
- Profiling information for PHP scripts
- Code coverage analysis
- Capabilities to debug your scripts interactively with a debugger front-end.
Once we install the extension in Visual Studio Code let's configure Xdebug. Basically, we need to enable Xdebug in our computer to be capable of creating a new debugging profile in VS Code and can handle the debugging options when we want to debug our code.
- Download Xdebug from the official site
- If you are using Linux or Mac OS you need to follow this command to install using PECL:
pecl install xdebug
And add the following line in the php.ini file:
zend_extension="/usr/local/php/modules/xdebug.so"
- If you are using Windows, first of all, we need to get the php info of our installation. That's done creating a PHP file with a
phpinfo()function. Copy all the source code and go to the installation wizard.
- Paste the html code and see the result, you should get something like this:
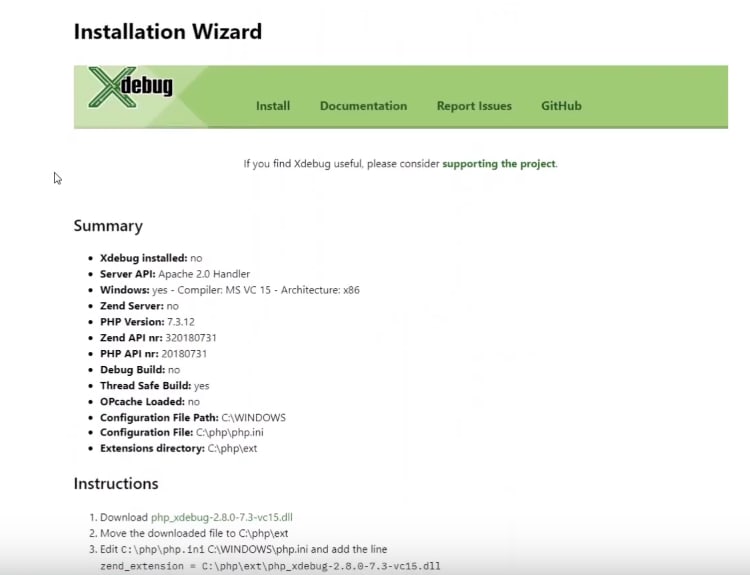
You need to download a .dll file in the download section according to the PHP version and architecture. Using the wizard you can get the direct link to the file, both options are correct.
-
Download the file and copy it to your PHP installation folder to the
folder
- We need to add the following line into our
php.iniand restart your web server
zend_extension = <your_route>\php\ext\<the_filename_you_downloaded.dll>
- And finally, enable the remote debugging by adding these lines to finish Xdebug configuration.
[XDebug]
xdebug.remote_enable = 1
xdebug.remote_autostart = 1
3. Debugging configuration in VS Code
Now we have Xdebug configured, we need to finish the setup in VS Code.
- Let's go to the Debug section and configure a new launch file.
- Select PHP and you can see a default JSON configured. If you wish to change the name of the profile and port used for the debugger you can do it, if not, you can close the file.
- And that's it! now you can set breakpoints into your code and active the debugging option to stop your web application and see your flow,
Summary
As you can see to activate the debugging feature for PHP is not as easy as install the extension, but I think the steps are really easy to follow. Please comment me if you were able to configure Xdebug to work with VS Code correctly, or if I missed an extra step to complete the setup.
And finally, thanks for reading my first post 😊. I would be gladded to hear your feedback and suggestions to improve my next post.

Top comments (2)
For Xdebug 3, there is a new setting available in php.ini:
Enable remote debugging in your php.ini:
xdebug.mode = debug
xdebug.start_with_request = yes
Your config is for xdebug 2. Please check the Php Debug extension in Vscode, under 3. enable remote debugging.
Marcos, I regret you lost me at "Let's go to the Debug section and configure a new launch file." Is this in VS Code? Debug section of what? I have version 1.46.1 and don't see anything obviously relevant but I'll keep looking. In any case, some clarification would be helpful for other readers.
Update: it works but I did not have to configure any launch file. I was hopeful when I saw In VSCode, that you can go down through the menu File > Preferences > Settings > Extensions but PHP Debug is not listed although it is listed as being "Enabled" under File > Preferences > Extensions". I restarted VSCode thinking that might be necessary but it made no discernable difference. However, I was able to go Run > Start Debugging and processing did stop at a breakpoint I set with the variables listed on the left.