DEV Community

Wataru Ashihara
Wataru Ashihara

Posted on

5 1

Chrome attach debug with WebStorm

1) Launch chrome with a command described in vscode-chrome-debug - Attach. Here we use port 9929 for the Chrome Debugging protocol (--remote-debugging-port=9229). Confirm that chrome properly listens the port:

$ netstat -an | grep 9229
tcp        0      0 127.0.0.1:9229          0.0.0.0:*               LISTEN

$ lsof -i :9229
COMMAND   PID USER   FD   TYPE DEVICE SIZE/OFF NODE NAME
chrome  18347  wsh  132u  IPv4 729759      0t0  TCP localhost:9229 (LISTEN)

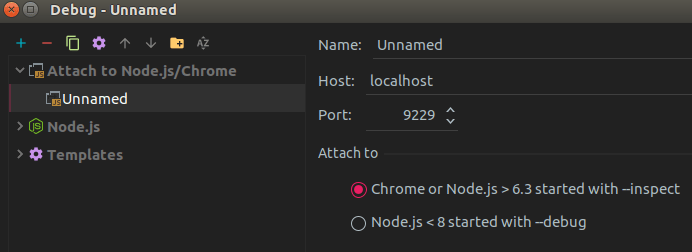
2) On WebStorm, create a Configuration of "Attach to Node.js/Chrome":
image.png

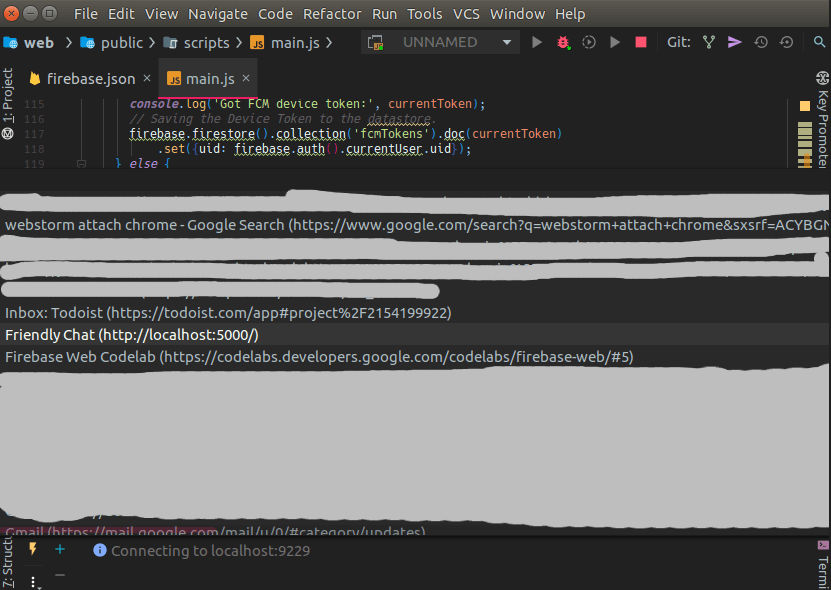
3) Start debug with the created configuration. A dialog appears with the list of the opened tabs, then choose the one you want to debug (Here I choose Friendly Chat from Firebase tutorial).
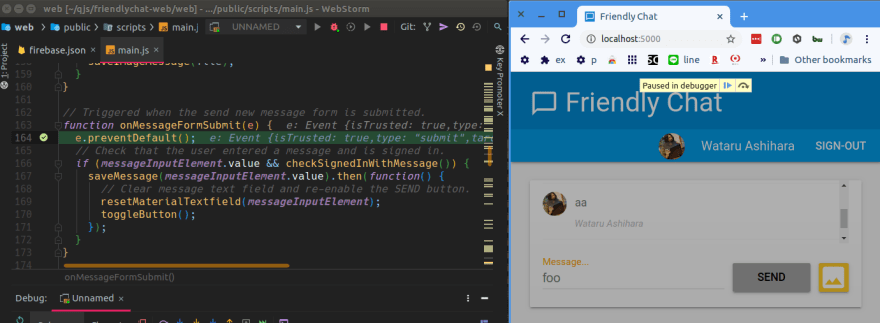
image.png
image.png

Way to go!

Postmark Image

Speedy emails, satisfied customers

Are delayed transactional emails costing you user satisfaction? Postmark delivers your emails almost instantly, keeping your customers happy and connected.

Sign up

Top comments (0)

A Workflow Copilot. Tailored to You.

Pieces.app image

Our desktop app, with its intelligent copilot, streamlines coding by generating snippets, extracting code from screenshots, and accelerating problem-solving.

Read the docs

👋 Kindness is contagious

Please leave a ❤️ or a friendly comment on this post if you found it helpful!

Okay