Introduction
Here's our latest tutorial from our blog. Thanks so much to the DEV Community for your interest in our free rapid development platform. Let us know what you think of this data visualization tutorial!
Stunning visualizations have never been easier. With WayScript, we can pull data from several different data storages, combine and process them on the same platform, and then display them into beautiful charts. Let's se how we can create online dashboards, coming from multiple sql databases.
Prerequisites
No prerequisites but some content you might find helpful:
Working with Databases
Working with Data Visualizations
Working with Dashboards
Pulling Data from our Database
Using SQL databases on WayScripts is very easy to do. Several SQL based database types are supported. If the specific database that you're needing to use isn't supported, please contact us.
After creating a script, to start using SQL in our workflow, it is very straight forward. We begin by pulling in the module from the selections to the left, and placing it into our desired workflow.

If you've never used that module before, you'll be asked to authenticate WayScript or to connect your database. If you get stuck in setting up your database, this video tutorial may be of use. After connecting your database, we can use the built in editor to write SQL commands against our database. Here, we're able to query our database, write to it, and anything else you'd be able to do locally on your own machine.
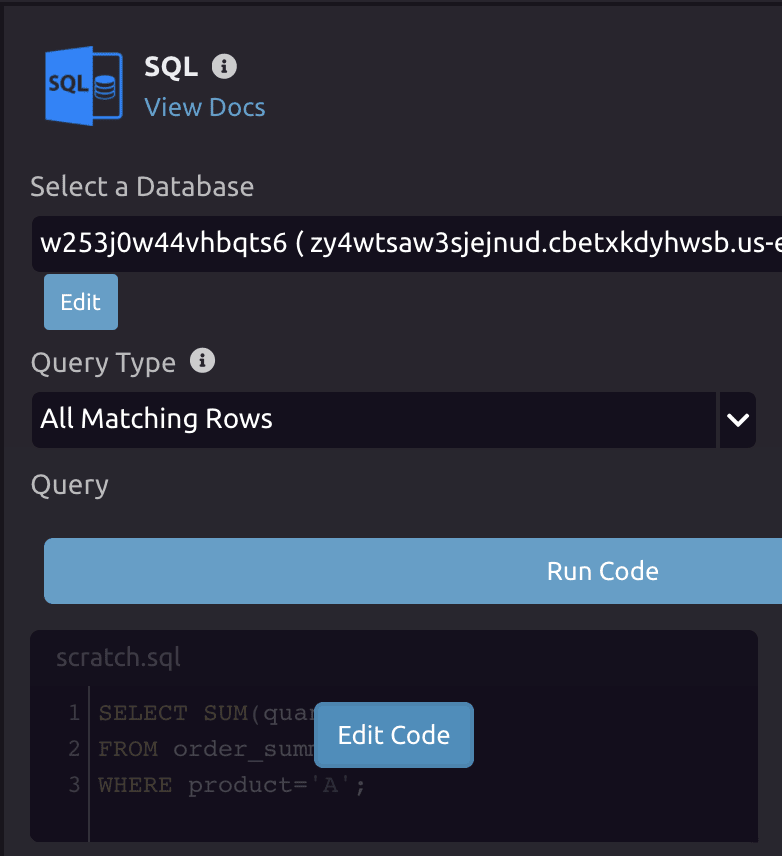
Our SQL can be whatever we need to meet our requirements. We can query and write from this editing screen. Let's write something simple:
SELECT SUM(quantity)
FROM order_summary
WHERE product='A';
We're able to import the values that we need for our dashboard by clicking on the import button to the left. This creates variables within our script that we can use between modules.

Next, we're able to process this data, or simply pass it to a dashboard.
Working with Data Visualizations
Using the built in data visualizations tools WayScript provides, we can create line and pie charts. If you need more in depth data visualizations tools, we would be happy to develop them for you! Just contact our team. Let's drag in a chart module to build this visualization.

With data visualizations, we can input our list type data to build our graphs. Here's an example of a simple one:
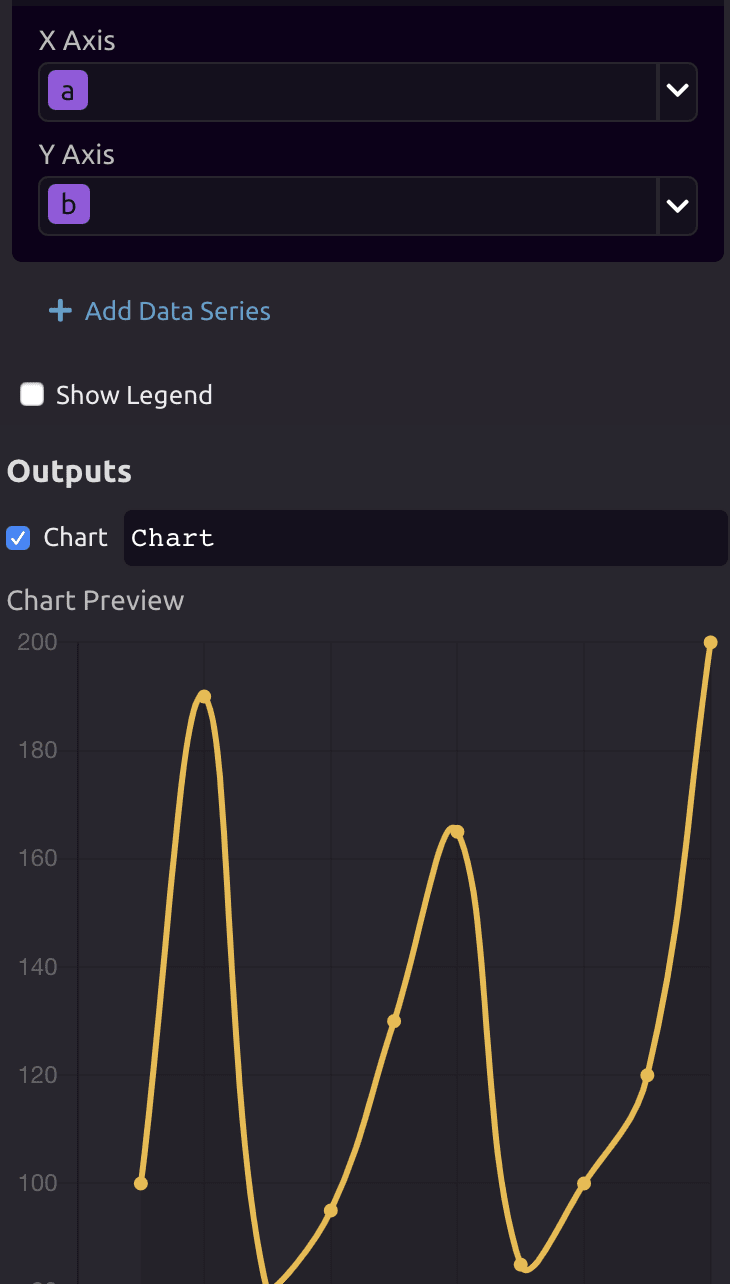
This graph becomes an object that we can pass throughout our script. That means we can pass this on to our dashboard response.
Working with Dashboards
To pass that chart object to a dashboard, we use the dashboard module. To use this, we'll need an active HTTP trigger at the top of our script.

Passing the chart to the dashboard response:

Example of a Completed Dashboard
If you'd like to view a completed dashboard, you can find one here. Each time someone visits the url, data is pulled, processed, visualized, and passed to the dashboard response. If you'd like to see the full script, it is here.

Top comments (0)