
Ethereum is a general-purpose blockchain that is more suited to describing business logic, through advanced scripts, also known as smart contracts. Ethereum was designed with a broader vision, as a decentralized or world computer that attempts to marry the power of the blockchain, as a trust machine, with a Turing-complete contract engine. Although Ethereum borrows many ideas that were initially introduced by bitcoin, there are many divergences between the two.
The Ethereum virtual machine and smart contracts are key elements of Ethereum, and constitute its main attraction. In Ethereum, smart contracts represent a piece of code written in a high-level language (Solidity, LLL, Viper) and stored as bytecode in the blockchain, in order to run reliably in a stack-based virtual machine (Ethereum Virtual Machine), in each node, once invoked. The interactions with smart contract functions happen through transactions on the blockchain network, with their payloads being executed in the Ethereum virtual machine, and the shared blockchain state being updated accordingly.
For those who are not familiar with blockchain technology reading History and Evolution of Blockchain Technology from Bitcoin article is strongly recommended. Also, if you wish to learn and practice Hyperledger blockchain development, visit Comprehensive Hyperledger Training Tutorials page to get the outline of our Hyperledger tutorial articles.
We have written two sets of tutorials to explore Ethereum and Solidity programming in depth. First set covered the following nine recipes:
- Introduction to Ethereum Blockchain Development with DApps and Ethereum VM
- Building Auction DApp With Ethereum and Solidity Programming Language
- Working with Ethereum Blockchain Applications through Remix IDE
- Building Bidding Form in Web3js for Ethereum Auction DApp
- Working with web3js API and JSON to Build Ethereum Blockchain Applications
- Deployment Environments for Managing Ethereum Smart Contracts
- Work with Ethereum Private Network with Golang with Geth
- Compiling and Deploying Ethereum Contracts Using Solidity Compiler
- Running Ethereum Auction DApp and Solidity Tips
In short, you learned about how to set up and configure Ethereum and develop blockchain applications using Solidity programming language. We explored its key components, including smart contracts and Web3.JS API via an Auction Decentralized Application (DApp) step-by-step.
In second set, we discuss more advance topics in Ethereum blockchain development and solidity while building a Tontine DApp game step-by-step. Specifically, we cover Truffle and Drizzle. For instance, we show you how a tool such as Truffle can be an assistant in building, testing, debugging, and deploying DApps. In summary, we are going to cover four main topics:
- Exploring the Truffle suite
- Learning Solidity's advanced features
- Contract testing and debugging
- Building a user interface using Drizzle
The 2nd set consists of 8 recipes as follows:
- Install Truffle and Setup Ganache for Compiling Ethereum Smart Contracts for Tontine DApp Game
- Run Tontine Ethereum DApp Game Contract
- Design Tontine Ethereum DApp Game Interfaces
- Contract Interactions between Ethereum and Solidity via Tontine DApp Game
- Work with Truffle Unit Testing in Tontine DApp Game
- Debugging with Truffle and Ethereum Remix in Tontine DApp Game
- Building Frontend Application for Tontine DApp Game with Drizzle
- Running and Playing Tontine Ethereum DApp Game
IMPORTANT: Understanding and completing the first set of recipes are required prior to working on second set of recipes.
In our first round of recipes, we learned a lot about the Ethereum ecosystem, but we are yet to realize the full potential of its different components. More precisely, we explored how Ethereum works, what a decentralized application (DApp) is and how to build one, and also covered the key concepts of Solidity and web3.js. We then introduced some of the most common smart contract design patterns (withdrawal from a contract, restricting access, state machines), before ending with a discussion of a contract’s cost optimization.
To brush up your knowledge and skills, on second round of recipes, we are going to build a Tontine DApp game. We will exploit this example to explore new tools that are going to change the way you build DApps, and introduce new Solidity features.
In this walkthrough, we will discover how a tool such as Truffle can aid in building, testing, debugging, and deploying our DApp.
Developers familiar with debugging will find this a welcome relief. Truffle and Remix provide built-in debugging features to help us understand where the code fails. This section provides a general overview of debugging in Truffle and Remix. If you are familiar with debugging using other IDEs, such as Eclipse or NetBeans, you will find Truffle and Remix similarly useful, even though they're less powerful.
Debugging with Truffle
Truffle includes a built-in debugger to debug transactions made against your contracts. It supports elementary debugging operations, such as code-stepping (over, into, out, next, and instruction), breakpoints, and watching expressions.
To try the debugging features, let's intentionally introduce a bug into the Ctontine contract and redeploy it into Ganache. Afterward, we will run the tests and use Truffle’s debugger to detect the source of the error.
First, in the Ctontine contract code, change the first require() statement in the join()
method as follows:
require(!Tplayer.exist(msg.sender));
As you can see, we reversed the required condition by adding an exclamation mark, "!", indicating that the player shouldn’t be registered in the Cplayer contract. This goes against our previous test's logic as we add the testing player before calling each unit test, including a test for the join() method.
Now, if you run the truffle test test/test.js --network my_ganache tests, you will see the following error:
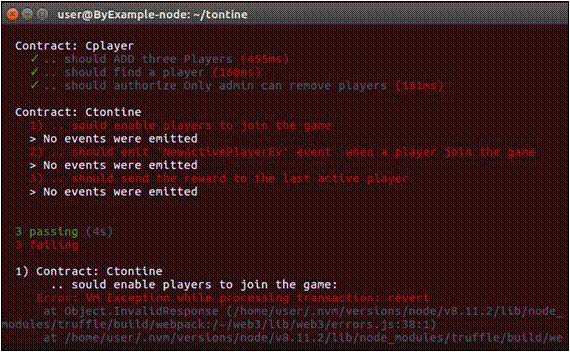
The output shows that we have a serious problem with the Ctontine tests and the VM exception while processing transaction error message isn’t much help in detecting the cause behind it. Let’s chase the bug.
Spotting the error
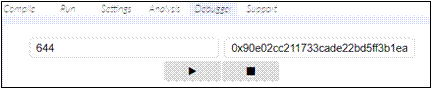
To debug the previous error, copy the transaction ID from ganache-cli:

Then feed it as an argument to the truffle debug <tx id> --network my_ganache
debug command.
In this case, we run:
truffle debug 0x90e02cc211733cade22bd5ff3b1ea1600781b48a1c792d867cda83190f773319 -- network my_ganache
Once executed, you’ll enter Truffle's debugging mode, as shown the following screenshot:

Keep pressing the Enter button to step through the code and trace the execution steps. Finally, the debugger will stop with an error message:

As a result, Truffle's debugger indicates that the exception (error) is raised due to a failed require() statement, as the evaluated expression (!Tplayer.exist(msg.sender)) will definitively always be false. This is because, if you remember, in the join() test we added the player first, therefore the exist() function will be always true, and hence our faulty require() will fail. The important point is that Truffle indicates to us where the code fails with an interesting message, instead of the previous error message generated by the VM.
Breakpoints and watching values
More importantly, Truffle’s debugger console enables you to toggle a breakpoint by pressing b and then pressing c to debug until reaching the breakpoint. Additionally, you can choose a variable (state or local) to watch using +:variable_name or by pressing v at any debugging step.
For example, if we debug the transaction initiated by the first (successful) Cplayer test (the addPlayer() test), we can visualize the values of each variable using the v option, as follows:

Make sure to experiment with all the debugger features introduced earlier. A good start point would be to read Truffle’s documentation.
Now, roll back the changes, and save the contract to try debugging with Remix.
Debugging with Remix
If you’re not a fan of CLI tools, Remix is a good debugging alternative for you. In fact, Remix provides a graphical interface with many more options.
Start and connect Remix to Ganache as we did in the previous recipes. Once connected, you will be able to debug the previous transaction we debugged using Truffle. First of all, we need to activate the debugging mode. There are several ways to achieve that, the easiest way being to browse to the debugger tab in the right-hand panel, and then provide either a transaction hash (transaction index) or a block number in the debugging input:
In Remix's right-hand pane, on the debugging form with several controls, press the play button to start debugging. You’ll get a debugging menu with the views depicted here:

The views are listed as follows:
- Instructions: Lists the executed opcodes
- Solidity Locals: Shows the content of local variables in the current scope
- Solidity State: Displays state variables of the current executing contract
- Step detail: Displays the current step's execution details (remaining gas and VM trace step)
      <li><strong>Stack</strong>:  Displays the local variables values stored in the stack</li>
      <li><strong>Storage</strong>:  Displays the contract storage entries(key, value) as shown here:</li>
    </ul>
  </ul>
</ul>

- Memory: Provides a view into the memory space that is used by the contract
- Call Data: Usually contains a 4-byte method signature followed by serialized arguments
The slider bar at the top (transaction section) helps you advance or roll back the execution of the transaction (debugging) easily to visualize the evolution of the available debugging information.
Below the slider, Remix provides a set of buttons at the top of the toolbar for controlling the execution of the transaction you are debugging:
-


 Step through a transaction's payload execution using the debugging buttons: Single over back
  , step back , step into , and step over
 -

 You can stop debugging and resume operations at any time using the respective debugging buttons: and
Debugging the previous faulty transaction using the transaction’s ID with Remix debugger boils down to dealing with crude information, including the list of executed opcodes. In this first case, the debugger shows us that the execution ends with a REVERT instruction:

If you follow the JUMP instructions and the values being loaded into the stack, you’ll be able to trace the source of the exception. However, I highly suspect you can't (or don't want to) deal with this hard task, which is why we are proposing an easier alternative in the remainder of this section.
Attaching the debugger to the code
Using Remix’s debugger with only the transaction ID can be a little troublesome for beginners trying to spot where the code breaks, without having the debugger attached to the code. To make the attachment, we need to load the contract code and connect Remix to the new instance you’ve migrated in Ganache.
First, import the contract file from Truffle’s folder, as follows:

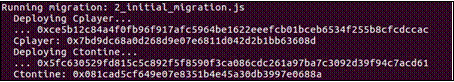
Deploy the contract into Ganache using truffle migrate –reset –network my_ganache, then retrieve the contract's address:
Under the Run tab, connect Remix to the deployed Ctontine contract using the At Address button (not Deploy). We then do the same for Cplayer. You’ll end up with two contracts loaded into Remix.
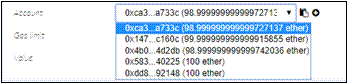
Then, we add three fictional players using addPlayer(). To add different players, change the account indicated in the transaction parameters in the top of the right-hand panel each time and execute the addPlayer() function (by pressing the addPlayer() button):
Now that we have three registered players, we can start interacting with the Ctontine
contract.
Watching values
Remix provides us with a watch window to observe and inspect contract variables. To use this feature, in the right panel, second tab from the left, fill in the Value input with 1 and ether:
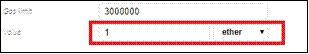
Then make the first player join the Tontine game by pressing the join button. When it completes successfully, change the account and call the join method with zero ether, and you’ll get the following error in the messages output:

Have you noticed the send higher pension message in the output console? If you remember, this message was defined in the require function to show us the reason behind the exception: require(msg.value >= 1 ether && Tpension[msg.sender] == 0, "send higher pension");.
Press the Debug button in the console or go to the Debugger configuration tab to go through the steps!
The Solidity State section will show us that, unlike the first player, the second player wasn’t added successfully, as depicted in the following diagram:

In addition, when the debugging panel loads up, you will see a blue highlight that marks the part of the code being executed as the debugging progresses, which provides precious assistance.
Notice the existence of a warning button under the debugging buttons. Once pressed, it will rethrow the exception and jump directly to the last opcode before the exception happened:

Setting breakpoints
As you know, breakpoints are the most basic and essential feature of reliable debugging. They represent a handy tool to help you examine in detail the execution of a specific section of code. As in other popular IDEs, in Remix breakpoints can be added and removed by clicking on the left margin of a line of code:

For example, let’s define two debugging breakpoints. Set the first at the line where the player is added to the active players array, and the second at the line where the current timestamp is recorded.
Now, make the second player join the game properly with one ether, then debug the transaction. Once the debugger starts, you can jump directly to your fixed breakpoints using the Jump to previous breakpoint, Jump to next breakpoint, or Jump out debugger buttons:
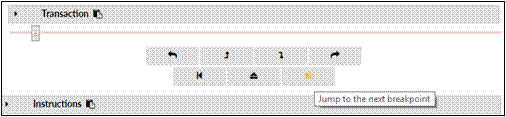
At the breakpoint, Remix's debugger suspends your running code so you can take a look at the values of contract's states and explore the memory or storage at the current execution level.
For the sake of brevity, breakpoints will be the last debugging feature we cover. You can refer to Remix's documentation (https://remix.readthedocs.io/en/latest/tutorial_debug.html) for more information about the debugger's advanced features.
This has been a long discussion on writing, testing, and debugging our contracts. With that in place, we can safely shift to the frontend and start building the UI components in our next recipe.
This recipe is written in collaboration with Brian Wu who is a senior blockchain instructor at Coding Bootcamps school in Washington DC.

Latest comments (0)