Here is an easy way to setup Grafana locally using docker and dotnet.
Grafana-Data-Sources
The current set up in this repo is very minimal. I am just touching the surface of what is possible. I wanted to demonstrate how to run the services locally
Build and run the api with docker on local port 4000
> docker build --pull --no-cache -t weather_forecast_api -f ops/docker/Dockerfile .
> docker run -p 4000:5000 --rm weather_forecast_api
You should now be able to view OTEL metrics from the API
> curl http://localhost:4000/metrics

# TYPE process_runtime_dotnet_gc_collections_count counter
# HELP process_runtime_dotnet_gc_collections_count Number of garbage collections that have occurred since process start.
process_runtime_dotnet_gc_collections_count{generation="gen2"} 0 1665568680770
process_runtime_dotnet_gc_collections_count{generation="gen1"} 0 1665568680770
process_runtime_dotnet_gc_collections_count{generation="gen0"} 0 1665568680770

.
.
.

# EOF
Build and run the api with docker compose
Using docker compose, we can combine multiple docker containers into a single deployment These containers can communicate with each other since we can specify what…
Please refer to the above repo for the source code to run the below commands and follow along.
Build and run the api with docker on local port 4000
> docker build --pull --no-cache -t weather_forecast_api -f ops/docker/Dockerfile .
> docker run -p 4000:5000 --rm weather_forecast_api
You should now be able to view OTEL metrics from the API
> curl http://localhost:4000/metrics

# TYPE process_runtime_dotnet_gc_collections_count counter
# HELP process_runtime_dotnet_gc_collections_count Number of garbage collections that have occurred since process start.
process_runtime_dotnet_gc_collections_count{generation="gen2"} 0 1665568680770
process_runtime_dotnet_gc_collections_count{generation="gen1"} 0 1665568680770
process_runtime_dotnet_gc_collections_count{generation="gen0"} 0 1665568680770

.
.
.

# EOF
Build and run the api with docker compose
Using docker compose, we can combine multiple docker containers into a single deployment.
These containers can communicate with each other since we can specify what network they can be added to.
First build the image
> docker build --pull --no-cache -t weather_forecast_api -f ops/docker/Dockerfile .
Then in the docker folder (ops/docker), run
> docker-compose up
Among other things, this will bring up Promethius. We have set Promethius up to scrape metrics from the /metrics endpoint of the weather forecaset API.
Notice in the promethius.yml file
static_configs:
      # replace the IP with your local IP for development
      # localhost is not it, as that is w/in the container :)
      - targets: ['weather_forecast_api:5000']
To confirm promethius can access the API metric scraping endpoint, browse to Browse to the targets page. You should see
Notice that the Status is UP
Grafana set up
Browse to the datasources page
username : admin
password : P@ssw0rd
Promethius
Set the URL to http://prometheus:9090 and then click Save & Test
Then go to the explore page and select promethius as the data source. You should be able to access the metrics
Custom metrics
As an example, I have added a custom meter counter that we can use to track the number of requests made to /WeatherForecast
In WeatherForecastController.cs We have
SharedTelemetryUtilities.RequestCounter.Add(1);
This will add a new metric with a name we have specified data.request_counter
We can now view this custom metric in Grafana
Loki
Set the URL to http://loki:3100 and then click Save & Test
Then go to the explore page and select loki as the data source. Under labels, select filename. You should have have a log file accessable.
Traces
In the endpoint /WeatherForecast I added some external calls to show traces in action. Once you make some calls to this endpoint, you will start to generate traces
Zipkin
Browse to zipkin and click RUN QUERY. This should display some traces
Clicking one of these traces will give you more detail. As you can see, there is an over all request and the 2 external calls.
Jaeger
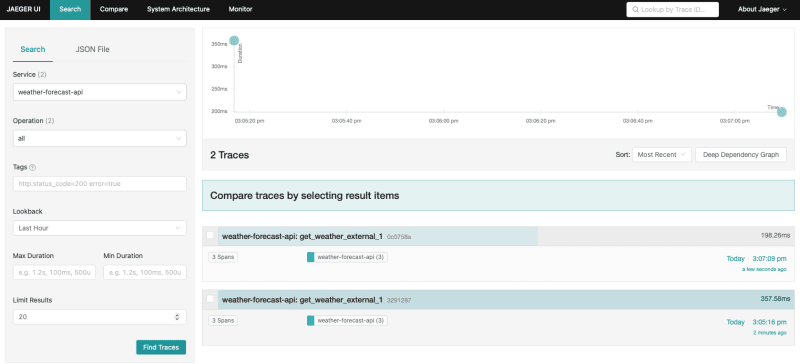
Browse to Jaeger, select a service and click Find Traces. This should display some traces
Similar to Zipkin, clicking on one of the traces will give more detail


Top comments (0)