


Version en français ici 🇫🇷
Prologue: Open the window and look at the sky 🌌
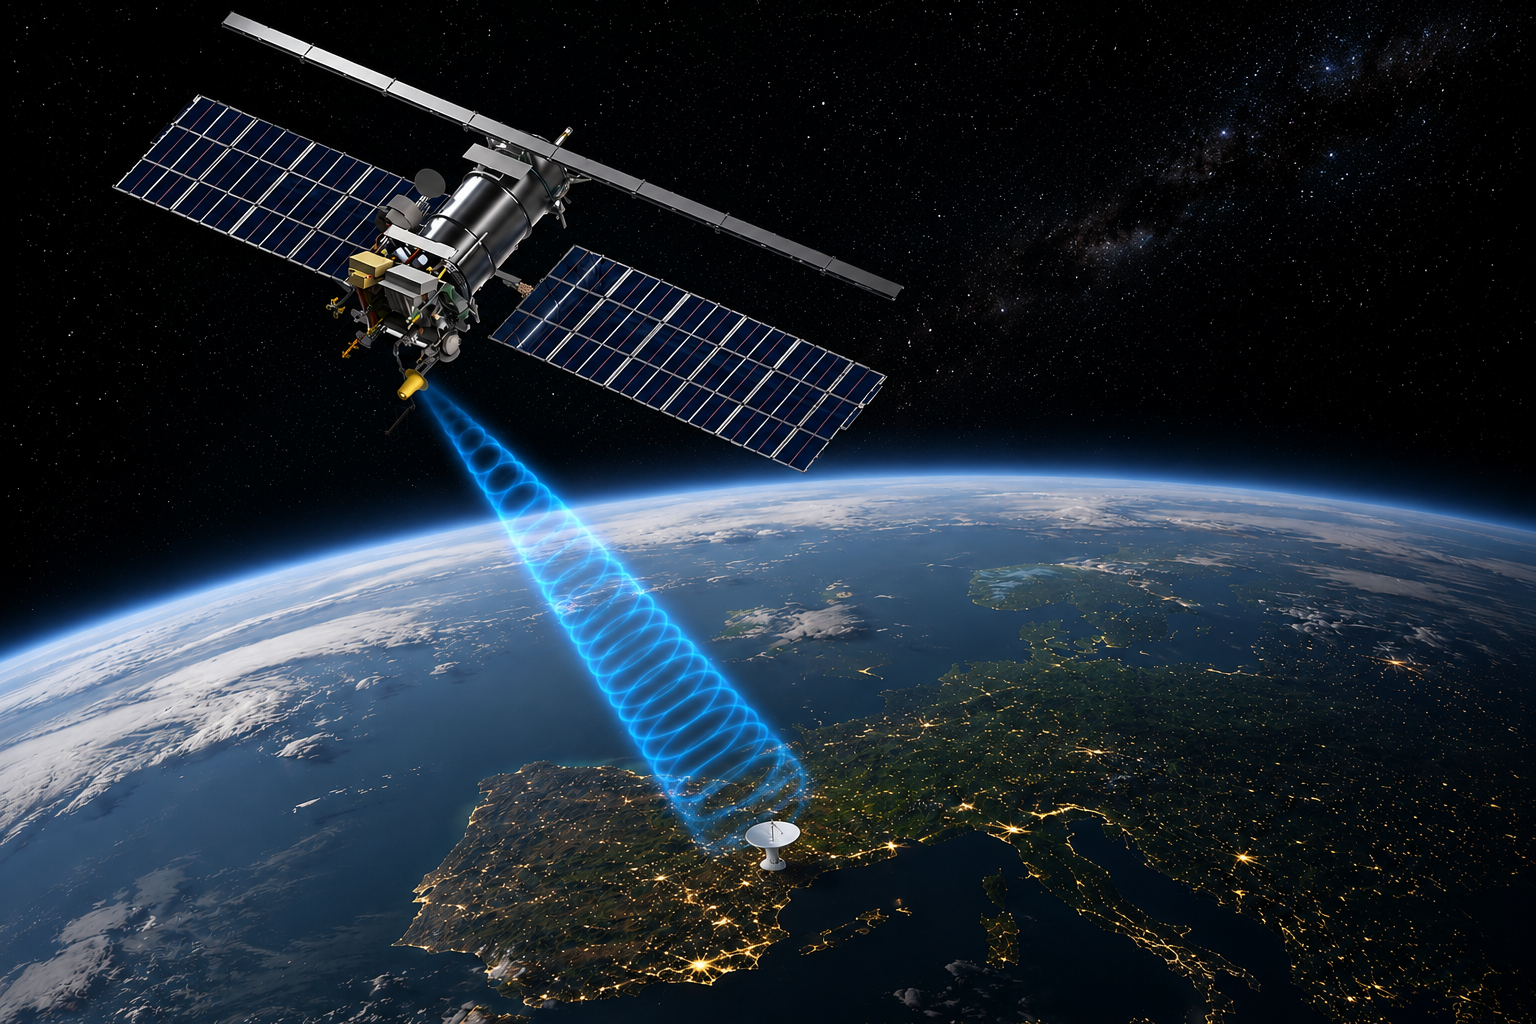
Right now, while you read this, multi-million euros satellites are passing over your head. Some of them are transmitting pictures of the Earth to anyone who cares to listen. Not just to their companies/makers or some governmental agencies, to anyone! The images go out unencrypted, raining down over whole continents on frequencies you can pull in with about 100 euros of hardware and a balcony facing the sky.
That is true for Earth pictures, for weather data, aviation/maritime tracking, amateur radio, even videos from the International Space Station 🛰️!
I didn't know that either... until I did! And when I did, I felt a new frontier opening up, like I could reach the stars for real, from my home. New space adventures and discoveries were expecting me, one satellite at a time.
This is a story about reaching (weather imagery) satellites. It's also a story of how a "let me just try one thing" turned into a distributed ground station running across two countries, a dead laptop resurrected as a server, my dad on a ladder in Théding, France while I watch from Barcelona, Spain and, as I write this, a geostationary satellite drifting slowly across the sky toward the one spot that would let me receive it. The project isn't finished. I mean that literally: this article ends on a spacecraft that is still in motion.
But I should introduce the cast first, because the difference between two kinds of satellite is the key to this whole project.
Weather satellites come in two families.
The first are polar orbiters 🛰️. They fly low, a few hundred kilometers up, and fast, looping North to South while the Earth turns underneath them, so they eventually pass over everywhere (over your home too! 👾). They're the ones I chase in this story: the Russian METEOR-M series, 800 km over our heads, broadcasting down in the VHF band around 137 MHz. The catch is they're only up there for about ten to fifteen minutes at a time. The satellite climbs out of the horizon, arcs over us, and drops away, and we have exactly that long to grab everything it's saying before it's gone. Miss it and you wait for the next orbit (~ 1-2 days!).
The second family are geostationary satellites 🌍. These sit ridiculously far out, about 36,000 km, in an orbit tuned so precisely that they circle the Earth in exactly one day, which means from the ground they appear to hang perfectly still. Fixed in the sky. Always there, always staring at the same face of the planet, broadcasting continuously. No ten-minute window 🤩. But they transmit way up in the L-band (~1.7 GHz), which is a different beast to receive. Hold onto these, they're where the story is heading, and the finale is one of them, the Elektro-L3 literally sliding into position.
Chapter 1: "What if I just point an antenna at the sky?"
The mission was clear, it was time for the first try: I bought a cheap RTL-SDR USB dongle, the kind that ships with a little telescopic dipole antenna in the box, extended and propped the antenna on my terrace, pointed it in a "looks about right" manner at the sky, waited for a METEOR pass, and hit record.

Let me tell you about that dongle, because it's genuinely one of my favorite facts in this hobby.
🤓 Cool facts for the techies: the little RTL-SDR receivers that this entire community is built on were never designed to be radios. They started life as cheap DVB-T television tuners, USB sticks for watching digital TV on your laptop. Around 2012, people poking at the chip realized you could bypass the TV decoding and get at the raw radio samples underneath, the unprocessed digitized signal, straight off the antenna.
Suddenly a 60€ TV stick became a general-purpose software-defined radio. It grabs a slice of radio spectrum, digitizes it, and shovels the raw numbers into your computer. Every actual radio thing, tuning, filtering, demodulating, turning a wobble in a signal into a pixel, happens in software, on your machine. So, in a sense, it does much less than a radio, it effectively is barely more than an antenna, and let you do the smart job with whatever signal you capture.
Which is beautiful, and also means that when it doesn't work, there's no "radio" to blame. It's just you.
And it did not work.
The satellite came over, right on schedule (more on why the schedule is so exact in a later chapter). I recorded the pass. I ran the decoder. And out came... this:

You see this near-black strip above 👆, that's the image I got. Not even a rectangular black image. Ten minutes of a satellite broadcasting a picture of Europe directly over my head, and I'd caught a black chopstick 🥢.
But that first, hmm, something, mattered, once I understood what I was looking at. It wasn't random. It was the fragment of the satellite pass where the signal briefly clawed its way above the noise: the moment the satellite was highest and closest, fighting through the least air and distance. Everywhere else, when it was low on the horizon and far away, its signal never climbed above the city's radio racket, and the decoder had nothing to work with but static, which it faithfully rendered as black ⬛️. The image wasn't a total failure, as it helped me diagnose my problem.
My problem was signal 📶. Or rather, the lack of it: the satellite is a few hundred kilometers up transmitting a handful of watts, and by the time that whisper reached my decoder, it was already down in the mud with all the background radio noise of a city. The decoder needs the signal to stand above that noise floor to reconstruct a picture. Mine barely did, once, at the top of the pass, and drowned everywhere else.
That black strip of radio noise wasn't exactly inspiring. But if the difference between black and a real picture was just signal quality, well, that was a problem with knobs on it. Knobs I could turn.
And the first knob had been in the box the entire time: the antenna! 📡 I did connect the antenna, don't get me wrong, but I'd treated it like an accessory when it was actually an instrument. A dipole antenna isn't just a piece of wire you point at things, it's a tuned object whose length is supposed to correspond to the wavelength you're trying to catch. Mine was tuned to nothing in particular...
🔧 Build notes: the absolute minimum to try this yourself
This is the naive setup that got me a black frame, deliberately bare-bones. It's still a perfectly good way to take your first swing, as long as you expect the black strip as a rite of passage rather than a failure.
- Receiver: an RTL-SDR Blog V3, the same dongle I run at both my sites. Get a proper "Blog" brand one, not the cheapest no-name stick: the good ones have a stable temperature-compensated oscillator (less frequency drift) and a built-in bias-tee you'll want in Chapter 3. Mine cost about 60€ delivery to Spain included with the dipole kit.
- Antenna: the telescopic dipole kit that comes with it is genuinely all you need to start... if you set it up properly, which I did not. How to actually dimension and orient it is the whole of Chapter 2.
- Target: METEOR-M2-3 and M2-4, downlink around 137 MHz VHF. (The exact per-satellite frequency comes in a later build-note, get it wrong and you'll record ten clean minutes of nothing. Ask me how I know.)
- Software: SatDump does capture and decode. First run: point it at the frequency, record the pass, decode. The full first-decode recipe and the config-crash gotcha that cost me an evening lands in Chapter 4.
- When to record: a pass is a ~10-minute window, look it up in advance. Pass prediction is covered in Chapter 4.
- Expectation setting: with an untuned antenna in a city, black-to-barely-there is the normal first result. The rest of this article will tell you how to get your first actual earth image.
Chapter 2: "The antenna: that stick that is so much more than a stick..!" 📡
It turned out the antenna had a manual. I had not read the manual. Classic Yann (that's me) move!
The dipole that ships with the RTL-SDR kit isn't fixed: the arms telescope, and the base lets you set the angle between them. And set those well is the difference between an pristine earth-image capture and nothing at all. For the 137 MHz band, the recommendation is very specific: each arm should be 53.4 cm long, with a 120° angle between them. I extended the telescopes to 53.4, set the V, and immediately the images got better.

Most of us only ever dealt with antennas on FM/AM radios 📻. And if you remember, getting those right was never big deal. It is due to the strength and the omnipresence of FM/AM signal around us. Satellite signal is a whole different story. That "ohhh antenna shape has a meaning" part took me a day.
🤓 Cool facts for the techies: that 53.4 isn't a magic number someone tuned by trial and error, it's just 137 MHz written in centimeters. Radio waves have a physical length. At 137 MHz, each wave is about 2.19 meters from crest to crest (that's the speed of light divided by the frequency). A dipole antenna needs to be half a wavelength long, tip-to-tip, so each of its two arms needs to be a quarter wavelength, which is about 54.7 cm, shaved down slightly to ~53.4 cm to account for the way real metal behaves at the ends (2-3% trim needed). Want to receive a higher frequency? The metal has to get shorter, because the wave is as well.

The dimension topic turned out to be the easy part. Orientation was the hard one, and I lost days on it.
Here's a low point I'll share for your benefit: at one stage I had the whole V standing upright, tips pointing at the sky, on the reasonable-sounding logic that the satellite is up there, so the antenna should point up there too. This is the single most intuitive mistake you can make, and understanding why it's wrong took me a while and a lot of back and forth discussions with my AI friends.
When the satellite is right over your head, its signal travels vertically towards you, but the signal's electric field E, the one that you will ultimately capture is perpendicular to the signal direction: in that specific case, it is horizontal. Put your antenna vertically and E has no effect exactly when the satellite is highest, closest, and screaming its clearest signal at you... I had built an antenna precisely optimized to ignore the best ninety seconds of every pass!
The fix that bought the biggest single jump in image quality in the whole project wasn't subtle: I laid it down flat. A horizontal dipole is broadside straight up, so instead of a null overhead I now had my most sensitive direction pointed at the heart of every pass. Vertical to horizontal, that was the leap!
The orientation was also a key aspect. The dipole antenna need to be running east–west, so the nulls fall east and west where the satellite isn't, and the broadside lobe covers the north–south arc it travels.

But getting orientation right taught me something I never expected about my own rooftop, my favorite fact in this whole chapter.
🤓 Cool facts for the techies: a polar weather satellite doesn't take a photograph. It builds its image one line at a time, like a flatbed scanner, or an old fax machine slowly spitting out a page. Onboard is a mirror that sweeps side to side across the satellite's direction of travel, painting one thin east-west strip of the ground beneath it. Then the satellite's own north-south motion carries it forward a notch, it paints the next strip, and the next, stacking thousands of them into a picture. The image is woven: the width comes from the scanning mirror, the height comes from the orbit. Now you understand why my first picture was a black strip.
Once you picture the image being built that way, a consequence falls out that's specific to where I live. I'm in an "interior" of Barcelona, a space boxed in by buildings that chew up my horizon to the north and south. You'd think that just makes my images worse. What it actually does is make them shorter, while leaving them full width, because of the scanning mechanism.
Each east-west scan line is drawn by the satellite looking down and out to the edges of its swath, roughly 2,900 km wide. It does not care in the slightest what my horizon looks like: for me to receive that entire line, I just need to be hearing the satellite at that instant and mid-pass, it's riding high overhead, well clear of any building. So I get the full width, every time. What the buildings steal is the beginning and end of the pass, the moments the satellite is low on the northern and southern horizons, hidden behind concrete before it ever clears my skyline. Those are the top and bottom of the image. So my captures come out like a wide picture: the complete east-west sweep of the continent, but trimmed short at the north and south ends, because Barcelona's rooftops decide how much of each pass I'm allowed to see.

Which planted a thought I wasn't ready to act on yet: some limits you can't amplify or re-orient your way out of. That building on my northern horizon was never going to move. If I ever wanted the slices of sky Barcelona was hiding from me, I wouldn't need a better antenna. I'd need a different sky. (Hold that thought, it's a couple of countries away.)
🔧 Build notes: the V-dipole, done right
The build, this time with the right orientation and configuration. It should give you a fairly good picture of the earth. 🌍
- Dimensions: each arm 53.4 cm (a quarter-wavelength at 137 MHz), measured from the central connector to the tip. Set both arms equal.
- Angle: ~120° between the two arms, the "V." (This broadens and evens out the overhead pattern versus a straight 180° dipole.)
- Get it horizontal: this is the big one. Lay the V flat. "Tips up" is the classic beginner mistake: it aims the antenna's deaf null straight at the overhead satellite, i.e. at the strongest moment of the pass. Flat = broadside overhead.
- Then choose azimuth: elements aligned **east–west; with an open horizon.
- Siting: the clearer your north–south horizon, the taller your images (see the scanning note above). East–west obstructions barely cost you anything.
- Polarization footnote (did-you-know): METEOR's downlink is circularly polarized, while a straight dipole (like our V antenna) is linearly polarized. Because of this, we lose roughly 3 dB from the mismatch. It works completely fine anyway. The properly-matched upgrade is a QFH (quadrifilar helix) antenna, which is on my someday-list and not yet built (a bit too pricey/cumbersome to build for the actual gain).
The antenna was finally an instrument instead of a decoration, and the images proved it. But the signal still sagged whenever the satellite was low, losing part of the received images. And, the antenna being well set by now, my guess was that some other part of my setup was dampening the signal. Which raised the next question.
Chapter 3: "What if I amplify the signal before the cable eats it?"
The antenna was finally an instrument instead of a decoration, and my images had gone from "black rectangle" to "recognizable coastline." Progress. But they still had a wound running through them, and it looked like this:

Those black horizontal strips are lost lines. Remember from the last chapter that the image is painted one line at a time. So, a black band is a span of time where the signal dipped below the threshold the decoder needs, and it simply had nothing to draw. The picture would come in clean for a while, then tear open into black, then recover. Whole passes ruined by the gaps.
So I went hunting for where I was losing signal. And I found it in the least glamorous component in the entire setup: the cable.
Here's the thing: there is about 10 meters of coax between my antenna and the dongle. I'd started with 5 meters, then hauled the antenna up off the terrace floor onto the pergola to clear more sky (taller images, exactly like the last chapter promised), which cost another 5 meters. 10 meters is a lot of cable to make a faint signal crawl through and coax cable is not a free pipe. Every meter of it attenuates the signal a little, bleeding away the faint signal that had already crossed 800 km. That alone is annoying, but survivable. The real problem is subtler and it's the crux of this whole chapter:
🤓 Cool facts for the techies: in a receiving chain, the order of your components decides your noise floor and the very first thing the signal touches matters more than everything after it combined. This is a genuine law with a name (Friis's formula for cascaded noise), and the short version is: every stage adds a little of its own noise, but each stage's contribution gets divided down by all the gain in front of it. So the first component contributes its full noise, the second contributes its noise shrunk by stage one's gain, the third shrunk even further. Put a good amplifier first, with real gain, and it mathematically drowns out the noisiness of everything downstream, including a cheap, electrically-noisy RTL-SDR!
Now here's the trap I'd fallen into, the one nobody tells you. A cable's loss isn't just loss, loss is noise. A lossy cable at the front of your chain behaves like a terrible first stage, quietly setting a noise floor that nothing downstream can ever undo. So the question isn't "how do I amplify the weak signal?" but rather "where do I amplify it?" and the answer decides whether it works at all.
If you put the amplifier down by the radio, indoors, where it's convenient to power and easy to reach, you've already lost. The signal has crawled through all that lossy cable first, arriving degraded, and then you amplify... but you're now amplifying signal-plus-cable-noise together. You've made the mud louder 🥲. If instead you put the amplifier up at the antenna, at the very feedpoint, before the cable, it lifts the tiny signal well clear of the noise floor at the earliest possible instant, and then sends that now-robust signal down the coax. The cable still takes its cut, but it's taking a cut of something strong. Same cable. Same amplifier. Opposite outcome, decided entirely by which end you bolt it to. And with 10 meters of it, getting that choice wrong would have been brutal.
The component that does this is a Low-Noise Amplifier, in short LNA, and the one I bought is a Nooelec SAWbird+ NOAA, built specifically for this ~137 MHz weather-satellite band. It does two jobs at once. It amplifies, first in the chain, at the antenna (the placement that matters). And the "SAW" part is a surface-acoustic-wave filter, a little band-pass gate that only lets ~137 MHz through and rejects the rest.
🤓 Cool facts for the techies: that filtering is more important than it sounds, because an amplifier amplifies everything, EVERYTHING!, including the strong signals you don't want. Cities are full of powerful transmitters just above the FM broadcast band: business radio, air traffic control, navigation beacons, etc... If you let all of that hit a wide-open amplifier, the strongest signals can overload it and desensitize it to the faint one you actually care about. The SAW filter slams the door on the out-of-band noise before it reaches the amplifier stage, so all that precious gain gets spent on your 137 MHz whisper and nothing else.
Note that it also means that you won't be able to capture non-137 MHz signals with this LNA, if you are interested in air traffic or other signals of the city, you better get a separate antenna for it.
I mounted the SAWbird right at the antenna feedpoint. It needs to be powered and the RTL-SDR Blog dongle comes to the rescue: it can push a small DC voltage up the same coax cable that carries the signal down (this is called a bias tee), so the amplifier sips its power through the very cable it's feeding 😻. One added option in the terminal command, and the LNA on the terrace comes alive.
And the black bands closed up ✨.
Not entirely, not on every marginal pass, but the difference was the most satisfying of the whole project. Passes that used to tear open into strips now came in whole, top to bottom. The images went from "recognizable but wounded" to "almost always complete." I'd stopped losing the satellite mid-sentence.

🔧 Build notes: adding an LNA the right way
- What to buy: a Nooelec SAWbird+ NOAA (~€50), an LNA with a built-in SAW band-pass filter centered on the 137 MHz weather band. There are SAWbird variants for other bands, get the NOAA one for METEOR/NOAA VHF. (Different target, different filter: a GOES/L-band build needs a different SAWbird entirely, which comes back in a much later chapter.)
- The one rule that matters: mount it at the antenna feedpoint, not down by the receiver. An LNA at the radio end is fighting the cable loss that already happened, an LNA at the antenna sets a low noise floor before the cable.
- Cable length is part of the equation: I run 10 m of coax cable from a pergola-mounted antenna to the RTL-SDR dongle. The longer the run, the more the "LNA at the antenna" rule matters, 10 m of loss ahead of the amplifier would have set a noise floor nothing downstream could fix.
- Powering it: enable the bias tee on an RTL-SDR Blog dongle to send DC up the coax to the LNA (no separate power cable to the roof needed). In SatDump/
rtl_sdrthis is a bias-tee flag/toggle; turn it off again when you use the dongle for anything else. When it's ON, you should see a green light on your LNA device.- Why the SAW filter earns its keep: an unfiltered LNA amplifies everything, and a strong nearby out-of-band transmitter can overload it and desensitize it to your faint signal. The filter rejects the junk before the gain stage. In a quiet rural spot you might get away without it, in a city you won't! Note that, the filter works even if the LNA is not powered. To get non-137 MHz signals from the same antenna, you will need to physically unplug it.
- Order of the whole setup, front to back: antenna → SAWbird (LNA + filter) → coax → dongle.
After that step, I had a properly-designed antenna, oriented for my sky, with a low-noise amplifier lifting the signal before the cable could spoil it. For the first time, catching a good METEOR pass felt reliable rather than lucky.
Which is, of course, exactly when a new kind of dissatisfaction shows up. Because now I was reliably catching passes... by standing at my laptop, at the right minute, manually starting a recording, then manually running the decoder, then manually saving the image. The bottleneck was no longer the radio. The bottleneck was me, poor human being that had other things to do than activating an antenna.
Chapter 4: "What if a computer did all of this while I slept?"
There's a specific kind of tired that comes from being the slowest part of your own system 🥲. I could catch a good pass now, but only by being physically present at the right minute, starting the recording by hand, waiting ten minutes, running the decoder, saving the image, and doing it all again for the next satellite a day later. The radio worked. The bottleneck had a name, and it was Yann (yeah, that's me!).
So I decided to remove myself from the loop. And the machine I chose to replace me with was one most people would have thrown away: an old MacBook, years past its prime, no longer trustworthy for anything a human needs to sit in front of. I wiped it, installed Debian, and exiled it to a storage room to live out its second life as a server.

🤓 Cool facts for the techies: a laptop, especially an old Mac with an SSD drive, is a secretly excellent home server, and it's sitting unloved in half the drawers in the world. Think about what it has that a Raspberry Pi or a cloud VM doesn't:
- a built-in UPS: the battery rides out the power flickers and shortcuts that would otherwise reboot your machine mid-pass
- a built-in screen and keyboard permanently attached for exactly the moment SSH breaks and you need to see what's wrong.
- a built-in Wifi and Bluetooth cards ensuring all the connectivity the home server needs.
It's an all-in-one, self-powered, self-displaying computer, and quite portable as well! We just got trained to see them as disposable the instant they can't run the latest OS 💻💔.
The brain of the operation is n8n: a very popular and open-source workflow automation tool that enables you to connect different services into one single app (e.g. connecting Slack to Claude AI and Linkedin API to generate and publish automated Linkedin posts).


n8n is my "satellite ground station" orchestrator: it figures out when the next satellite pass is, turns on the RTL-SDR radio, records the signal, decodes it, processes the image, and drops the result into the public gallery. All of this using a scheduler, unattended, while I sip my Virgin Vodka Martini 🍸.
🤓 Cool facts for the techies: you can know exactly when a satellite will fly over your house days in advance, down to the second: their orbits are deterministic. Their path is published as a TLE (a "two-line element set"), a terse ~140-character text record of the orbit's shape and orientation at a known moment. Feed that TLE and your coordinates into a propagator and it runs the physics forward to tell you the satellite rises above your horizon at, say, 14:03:27 tomorrow, climbs to 71° elevation, and sets at 14:16.

I did not do the calculation myself. Instead I query the N2YO API. On top of the satellite position, I also calculated the sunrise/sunset using the Sunrise-Sunset API, the METEOR satellite camera is too weak to detect any night light coming from earth, images captured after dusk are essentially black ⬛️.
When the satellite is right above my antenna and the sun shines in the sky, n8n runs this:
# 1. Record the pass to raw baseband
rtl_sdr -f 137900000 -s 2400000 -g 20 ~/satellite-images/meteor_$(date +%H%M).raw
# 2. Decode the raw samples into an image
./satdump pipeline meteor_m2-x_lrpt baseband \
  meteor_HHMM.raw decoded_HHMM \
  --samplerate=2400000 --baseband_format=cu8
The decoder is SatDump, the Swiss-army knife of satellite image reception. It turns raw radio samples into jpg pictures of the Earth.
The last piece was publishing. The decoded images needed a home on the internet, and I decided to use Coolify to deploy a satellite image gallery webpage painlessly. Think of it as a self-hosted Heroku or Vercel. It manages the hosting of my websites (through Docker containers), gives me dashboards and git-push-style deploys, and turns my old MacBook Pro 2011 into my own little cloud platform ☁️ 💻 ☁️.
The gallery webpage itself is a simple nginx container serving the images on an index.html page. It is live on satellite.yannklein.dev reachable from anywhere in the world despite the MacBook sitting on a home connection with no fixed IP address, thanks to a Cloudflare tunnel. (How that tunnel works with no fixed IP and no open ports is quite interesting, but I'll save it for the chapter where it does something much more impressive: reach signals beyond national borders.)

For the first time, the whole thing ran without me. I'd wake up, check my phone, and there'd be a fresh picture of the Mediterranean that an outdated MacBook laptop had caught, decoded, and published while I was away.
🔧 Build notes: automating the capture→decode→publish loop
The starter-tier parts (recording + decoding) are real, copy-pasteable commands. The orchestration stack is described so you can rebuild the shape. I published my actual n8n flows and configs in this repo folder.
- Record a pass (raw baseband, the input to everything):
rtl_sdr -f 137900000 -s 2400000 -g 20 ~/satellite-images/meteor_$(date +%H%M).raw
-f 137900000= 137.9 MHz. For M2-3 and M2-4, 137.9 is primary. (Gain-g 20works well once the SAWbird is lifting the signal, with a strong LNA up front you often don't want max gain, which can overload the dongle.)
- Decode it with SatDump's METEOR LRPT pipeline:
  ./satdump pipeline meteor_m2-x_lrpt baseband IN.raw OUT_DIR \
    --samplerate=2400000 --baseband_format=cu8 --fill_missing
--fill_missinginterpolates dropped lines so the odd remaining signal gap is patched rather than left as a black strip, a nice finish on top of the SAWbird's work from Chapter 3.
- The gotcha that cost me an evening: if SatDump reports no decoders/plugins, you're running it from the wrong place, launch it from its own
build/directory, not a system install.- in my case SatDump is built from source (there are different ways to install it). It compiles and runs happily on old, low-powered hardware, so don't let an ancient laptop stop you.
- Predicting passes: orbits are deterministic use N2YO API to schedule captures.
- When the image is empty and it's not you: METEOR-M2-3 has a partially undeployed antenna 😅, it is a weak, intermittent signal. Check the satellite's status (the APT Group community reports live pass quality) before blaming your setup.
- The stack, in a nutshell: old laptop → Debian → n8n (orchestration) → SatDump (decode) → Coolify (self-hosted PaaS managing Docker) → nginx container (the gallery) → Cloudflare tunnel (public access, no fixed IP). Every piece is free and open-source.
What an epic journey since my first tries at capturing earth pictures! I built a machine that caught the sky for me and put the results online. But the pictures it was publishing were still raw, gray, and, I was about to discover, some of them were upside down and backwards.

Chapter 5: "What if these gray scans could become real color maps?"
My old MacBook was now catching passes and publishing them without me. There was just one problem with the pictures it published: they were gray and distorted. They were still raw output from a scanner in space. The gorgeous color maps I'd seen other people post, coastlines crisp against a map, cities labeled? Those took three more steps. This chapter is about those steps.
Step one: color.
A METEOR satellite doesn't see in "color" the way your eye does. Its scanner, the MSU-MR, looks at the Earth in several separate spectral bands at once. It produces 3 simultaneous black-and-white photos, each taken through a different filter: one in visible light, one in near-infrared, one in shortwave-infrared. Each is just a grid of brightness values.


To make a color image, you assign three of those bands to the red, green, and blue channels of a picture and let them mix. That's a false-color composite. "False" because the colors aren't what your eye would see, it's a mapping chosen to make certain features leap out.
I use 3 recipes from SatDump to produce false-color images highlighting interesting features:

- False Color AVHRR 221 (Red = Ch.2, Green = Ch.2, Blue = Ch.1): a general-purpose false-color view built from the two reflective channels; my everyday go-to for land/vegetation contrast.
- False Color AVHRR 3a21 (Red = Ch.3a/SWIR, Green = Ch.2/near-IR, Blue = Ch.1/visible): the shortwave-IR channel is sensitive to intense heat and to scorched ground, so this is the one where active fires and burn scars jump out in stark red/orange against the rest of the scene.
- MSA: a dedicated hotspot-detection enhancement rather than a simple RGB remap; it flags thermal anomalies directly, which is what pulls out the fainter or smaller fires the false-color composites can miss.

🤓 Cool facts for the techies: in these images you can tell a cloud from a smoke plume and the catch is particle size! Clouds are made of relatively big water and ice droplets, and big droplets scatter all wavelengths of light more or less equally (visible, near-infrared, shortwave-infrared). Bright in all three channels means bright Red + Green + Blue, which mixes to white. Smoke is the opposite: it's made of tiny particles, and tiny particles preferentially scatter only the shortest wavelengths while letting longer ones pass straight through. So smoke is bright in the visible band but nearly transparent in near- and shortwave-infrared. In this recipe the visible band is wired to Blue, so smoke lights up the blue channel and almost nothing else, and comes out a distinct, ghostly blue against the white clouds around it.
And the fire's footprint shows up too, by the opposite logic: healthy vegetation is intensely bright in near-infrared (that's the Green channel here, which is why Spain glows yellow-green), so a burn scar, where the vegetation has been burned, goes dark and stands out sharply against the green land around it. In a single frame you can see the fire's scar and its smoke, by the different ways matter interacts with different wavelengths of light.
Step two: projection. Now the images were colorful but still wrong-shaped.
🤓 Cool facts for the techies: a raw satellite scan is badly distorted, and the distortion is worst at the edges. The scanner sweeps a huge arc, nearly 3,000 km wide, and near the ends of each sweep, it is looking at earth through a shallow, grazing angle, so each pixel smears across far more ground than a pixel taken looking straight down. The raw image is in "satellite-perspective", not your typical "world map-perspective".

Projection (or geo-referencing) fixes this. We know the satellite's exact orbit and orientation for every scan line, so we can compute the true latitude and longitude that each pixel is looking at, and re-draw the whole image warped onto a proper map grid. Suddenly the distorted coastline snaps onto the real coastline we're all used to seeing. It's one of the most satisfying picture upgrades of the project. (Tech-wise, the raw channel image is about 1568 px wide, the corrected composite is stretched to ~2800 px to undo the panoramic distortion, about 1.79× horizontal correction)
Once every pixel has a real-world coordinate, a lovely thing becomes possible: you can put labels on it.
I wrote 2 small scripts:
-
compute_barcelona_px.py: does the reverse of projection: given a place's latitude and longitude, it computes which pixel that place is on. -
add_map_overlay.py: uses it to drop city markers exactly where they belong: Barcelona on its cape, Madrid inland, Marseille and Rome and Algiers each pinned to the right dot. The map stopped being a pretty picture and became a referenced one.
Step three: the flip
About half my images were coming out upside down and mirror-flipped. I spent an evening convinced something was broken in my processing. But I would soon figure out that nothing was broken..!
Remember that a polar satellite paints its image line by line as it flies, and that it can cross my sky in one of two directions: sometimes it's heading south (a "north-to-south" pass), sometimes north. When it flies the opposite direction, it paints the picture in the opposite direction and because it's also looking out the other side, left-and-right swap too.
The fix, once I understood it, was almost trivial: figure out which direction the satellite was traveling and flip the ones that need flipping. You can read the direction straight from the N2YO API pass geometry, the azimuth where the satellite rises, and flip those frames 180°.
A key detail: I run two SatDumps.
SatDump is a wonderful, fast-moving project which sometimes means a feature you rely on is not or partially available in the build you're running. My main decoder is the latest version of SatDump, and it's so new the dev team haven't had the time to add the map-projection and geo-correction to it yet. So, to get properly projected maps, I installed a second, older build (v1.2.2) alongside it, pinned purely for the projection step. Not the cleanest image processing flow, but it has the advantage of working for now 😬
And then, the payoff.
With color, projection, and city labels all working, I could do the thing I'd secretly wanted since the first black frame: stack them. I built a little viewer (AI-assisted, more on that way of working later) that takes every pass from a day, projects them all onto the same Barcelona-centered map, and plays them as a crossfading timelapse. Fifty-two passes, the weather of a whole day flowing across a fixed map of my corner of the world, cities holding still while the clouds move over them.
🔧 Build notes: from gray scan to labeled map
- False color: in SatDump, the
321/3a21composite maps ch3 (SWIR)→Red, ch2 (NIR)→Green, ch1 (visible)→Blue. Great for separating vegetation (green), clouds (white/cyan), smoke (blue), and burn scars (dark). Composites are defined insatdump_cfg.jsonunder the instrument'srgb_composites, each with anequationlike"ch3, ch2, ch1".- Projection: enable
geo_correctandproject(withdraw_map: true) in the composite config so SatDump warps the raw swath onto a real map grid and draws coastlines. Georeferencing is what makes labels and stacking possible.- The 180° flip: if half your passes come out upside-down-and-mirrored, that's pass direction (ascending vs descending). I detect direction from the rise azimuth (
startAzbetween 90–270° =NtoS) and store it as adirectionfield in each pass'smeta.jsonand inpasses.json. Then I fix it in two places: the processing step rotates theNtoSchannel images 180° server-side with ImageMagick (convert "$f" -rotate 180 "$f"), and the gallery also flipsNtoSframes for display with CSStransform: scale(-1,-1).- Labels: once projected, every pixel has a lat/lon, so you can go backwards, compute the pixel for any city's coordinates, and overlay markers. (My
compute_barcelona_px.py+add_map_overlay.pydo exactly this; I'll publish them with the rest.) More details in this repo docs. For the first time, the gallery looked like the thing I'd set out to make. Real color, real maps, my city labeled at the center. I could have stopped there. It was, by any reasonable definition, done. But there was that one limitation... the buildings around my rooftop that would prevent me from getting more than a thin band of Europe ground on my satellite pictures.

Chapter 6: "What if there were a second antenna, in another country?"
You can't move a building, I established that 🥲. So I stopped trying to fix my sky, and went looking for a different one.
I have family in Théding, a small town in the Moselle, in the northeast of France. Open sky, a real horizon, and the part that turns this from a hardware project into a story: my dad, willing to be my teammate in this satellite adventure 1,000 km away.
Here's how the collaboration actually works. I set up everything on the computer side from Barcelona, remotely, over SSH. My dad's job is the thing I can't do from 1,000 km away: physically place and aim the antenna. And then, this is the cool bit, I created his own copy of the gallery website. He'll open and use it in his own browser, watch for the images to come in, and adjust his antenna based on what he sees. He is effectively the field operation engineer of the Théding satellite imagery ground station.
The Théding station had one main constraint that taught me a lot about my system and how I would/could scale it further.

The machine in Théding is an old i386 netbook, ancient and far far far weaker than even my resurrected MacBook. It cannot decode a satellite pass in any reasonable time. It can't run the projection step. It can't even run my usual trick of keeping an AI assistant on the machine to help me work on it, it's simply too underpowered to be a development environment at all. By every measure, it's the wrong computer for the job 😅.
So I gave it exactly one job.
🤓 Cool facts for the techies: the smart move with a weak remote node is to make it do almost nothing, and push all the real work to wherever the compute actually lives. The Théding netbook does only this: when a pass is due, it records the raw radio samples to a file, writes a tiny sidecar of metadata (which satellite, what time, which direction), and reports back. That's it. The raw file gets pulled south, and my Barcelona homeserver decodes it, colors it, projects it, and publishes it to my dad's gallery, exactly as if the pass had happened on my own roof.
And that design is why the next detail matters so much.
🤓 Cool facts for the techies: you can shrink your data roughly tenfold, by not sampling faster than you need to. In Barcelona, where the raw file never leaves the machine, I record at 2.4 million samples per second (-s 2400000). In Théding, that same raw file has to travel 1,000 km across a netbook's modest home connection, so I record at 250,000 samples per second (-s 250000) instead. That's about a tenth the file size, and the beautiful part is that the images are just as good! METEOR's LRPT signal is only about 120 kHz wide. Sampling rate has to be at least twice the width of the signal you want to capture (a rule called the Nyquist-Shannon theorem), so 250 kS/s covers a 120 kHz signal quite fine.
The last question was how Barcelona even talks to a netbook in France and this is where a trick I've been hinting since Chapter 4 finally earns its keep.
🤓 Cool facts for the techies: normally, to reach a machine remotely, you'd need it to have a fixed address and open a port to the world, which is both a hassle (home IPs change) and a security liability (open ports get scanned and attacked). I used a Cloudflare tunnel which inverts the flow: a small program on Théding's netbook makes an outbound connection to Cloudflare and holds it open, and all my traffic reaches the netbook by riding back down that connection the machine itself opened. The netbook in Théding is reachable from anywhere, and simultaneously invisible to the entire internet. From Barcelona, my server reaches it as simply as ssh theding, and the tunnel does the rest underneath.
So the full journey of a Théding pass looks like this:
- my homeserver, on schedule, reaches across the border through the tunnel and tells the netbook to record
- the netbook captures a lean 250 kS/s raw file and reports the path back
- the homeserver
rsyncs that file to Barcelona and then the homeserver's typical decode-color-project-publish pipeline from the last three chapters runs on it, and a picture of the sky over France appears in my dad's gallery, and mine.
As of September 2026, everything is up and running, but we are still searching for a good place to install the antenna in Théding. I hope to have nice pictures to show you soon.
🔧 Build notes: a second, remote capture site
- Split the work by where the compute is. The remote node does the minimum: record raw baseband, write a metadata sidecar, report the file path. All decoding/projection/publishing happens back on the capable machine. A weak remote box (mine's an i386 netbook) is fine, it's just a sensor.
- Sample only as fast as the signal is wide. METEOR LRPT is ~120 kHz wide, so 250 kS/s captures it fully (Nyquist-Shannon: sample ≥ 2× signal width). That's ~10× smaller than a 2.4 MS/s file, decisive when the raw has to travel over a modest remote connection. Locally, where the file never moves, 2.4 MS/s is fine.
- Reach the remote site with a Cloudflare tunnel, not port-forwarding. Run
cloudflaredon the remote node; it dials out, so you need no static IP and no open inbound ports (works behind NAT/CGNAT, survives IP changes, nothing exposed to attack). Then it's justssh <alias>from home.- The n8n hop, honestly: n8n runs on the homelab and reaches the remote site through a normal SSH host alias (
ssh theding, with the tunnel configured underneath in~/.ssh/config). It records remotely, thenrsync -e ssh theding:$RAW $LOCALpulls the file home for decoding. Keeping the far node dumb also keeps this dead simple.- Develop remotely. I edit the far site's code from my laptop with VS Code's remote-SSH over the same tunnel, the netbook is too weak to host a real dev environment itself, but it doesn't need to; the files feel local, the machine just holds them.
Now I had two potential skies. An open one in France and a boxed-in one in Barcelona, both feeding the same pipeline, both publishing to galleries anyone could visit. The project had become a small, distributed, two-country ground station, something I never imagined building in the first place 🚀.
And I could, at last, have stopped.
But there was a whole other kind of satellite I still couldn't touch: one that never moves at all.
Chapter 7: Where it stands
It is time to officially present the final version of my Satellite image gallery.
A work that doesn't look fancy at all. A work that many don't understand (countless people asked me why I was doing that). But a work that taught me a lot, that made me dream of space a bit, that made me feel that I could do a lot with few resources and a bit of ambition.
Each chapter of this epic took quite some time, hours of frustrations, of research. I used countless workarounds to make up for my very poor setup (I am working with an old TV dongle and two outdated laptops after all..!). I loved/hated every minute of it!
And the machine keeps running. I don't do anything now, the whole loop runs on its own. Passes are predicted, the radio is freed up, the recording starts, the decode runs, the images get colored and projected and flipped and published, all unattended, on a schedule, at both sites. I wake up to new pictures of the Mediterranean I did nothing to earn that morning. I am now in a situation where I actually ask myself what I should do with all these pictures..!
Over more than 3 months, it has filled a gallery that anyone can open right now:
- Barcelona: satellite.yannklein.dev
- Théding (my dad's sky): satellite.sergeklein.com (live, but still empty,the antenna is not installed yet)
But I promised you at the start that this saga isn't finished, and I meant it.
Everything I've built chases satellites that move, that rise, arc over, and set inside ten minutes. But there's a whole other population up there that does something my polar satellites never do.
They hold perfectly still.
Chapter 8: "What if I could catch a satellite that never moves?"
Everything so far has been about chasing. Polar satellites are fast, low, and gone in ten minutes. The entire architecture, the prediction, the timed recordings, the flip logic, exists to catch their ephemeral passes. But the most spectacular weather imagery in the world doesn't come from those. It comes from satellites that hang motionless over the equator, 36,000 km up, staring at an entire hemisphere at once, all day, every day.
I wanted one. Specifically, I wanted Elektro-L, Russia's geostationary weather satellites, the only one to broadcast their imagery unencrypted on the L-band, around 1691 MHz. It broadcasts a full-disk view of the Earth, the kind where you see a whole quarter of the planet turning under its weather in a single frame.
And catching a satellite that never moves is, in one crucial way, easier than catching one that does. There is no pass, it is always out there. You just need to point a dish (remember those satellite TV dishes?) at one spot in the sky, the exact spot the satellite is parked and never move it again. So I got the hardware: a Discovery Dish, a small parabolic dish with an L-band feed tuned for the ~1.7 GHz band.

There was just one problem, and it's a big one.
🤓 Cool facts for the techies: western Europe currently has no working unencrypted geostationary weather satellite to receive. The slot that covers my part of the world, 14.5° West, out over the Atlantic, is held by the older Elektro-L2, but its L-band transmitter died from a power-supply failure. It's still up there, but silent on the frequency I can receive.
But here is why I bought the dish despite this frustrating fact:
There's a newer satellite, Elektro-L5, launched in February 2026. As of early August 2026 it has become operational in the 76° East slot: over the Indian Ocean, too far from me for now. But its arrival is a blessing for me: it frees up the satellite that used to hold 76°E, Elektro-L3, to relocate. And L3's newly-assigned destination is 14.5° West, my slot 🎉. When L3 arrives, western Europe gets its unencrypted geostationary L-band back for the first time in years, and my dish will finally have something alive to listen to.
So how does a satellite that's supposed to never move get from one side of the planet to the other?
🤓 Cool facts for the techies: you move a geostationary satellite by deliberately putting it in the wrong orbit, briefly. A satellite sits still relative to the ground only because its orbit is tuned so its speed exactly matches Earth's rotation. Raise it into a slightly higher orbit and it now travels a longer loop at a slower pace, so it falls behind the Earth's spin and from the ground it appears to drift westward, a little each day. You let it coast at that higher altitude, drifting, until it's over the longitude you want. Then you lower it back to the exact geostationary altitude, its speed re-matches the Earth, and it locks into place at its new home. You don't fly it sideways across the world. You lift it, let the planet turn under it, and set it back down.
We know exactly what this looks like because L3 is about to retrace a path its sibling already took. When Elektro-L1 made this very same 76°E → 14.5°W journey in 2016, it was raised about 289 km higher than geostationary altitude, which set it drifting west at 2.03° per day. The trip took roughly 45 days, after which controllers gradually lowered it, until it parked precisely at 14.5°W and stopped. L3 is expected to do the same thing: a slow, deliberate, weeks-long slide across the sky, propelled by nothing more dramatic than being slightly too high and letting the world spin beneath it.
As I write this, L3 hasn't left yet. I can see it in my satellite tracker, and it's sitting right next to L5, the two of them side by side over the Indian Ocean. Any day now, L3 will fire its thrusters, nudge itself into that slightly-too-high orbit, and begin the slow westward crawl toward the empty slot over the Atlantic, toward me.
So, as of today, my dish is aimed at an empty patch of sky over the Atlantic, waiting for L3 🛰️.
Epilogue: The road ahead
Every chapter of this has ended with a what if that pulled me into the next one, so it would be dishonest to end the article as though the questions have run out. They haven't. Here's what's still open as I write.
The obvious one: I'm waiting for a satellite. Elektro-L3 is still parked next to L5 over the Indian Ocean, and until it fires its thrusters and makes the six-week crawl west, my dish stares at an empty patch of Atlantic sky. That's the cliffhanger I genuinely cannot resolve on any schedule but the satellite's.
My dad's antenna still needs a permanent home. The netbook has to stay dry and sheltered; the antenna has to live outside with a clear view. Turning that into a weatherproof, doesn't-need-a-ladder installation in a garden in the Moselle is the next real, physical job and it's why his gallery is still empty.
And there's a fork in the road I haven't chosen. That fixed dish could become something more ambitious. METEOR doesn't only broadcast the low-resolution LRPT I've been catching on 137 MHz, it also transmits a much higher-resolution image called HRPT, up on L-band, near 1700 MHz, right in the dish's range. The catch is that METEOR moves, so to receive its L-band signal I'd need to physically track it across the sky, which means a motorized az/el rotator. There are cheap-ish options now (the portable AntRunner runs about €300 landed).
The point of a project like this was never to finish it. It was to keep finding the next question worth chasing. I started with a bit of wire and a black rectangle, and I ended (haven't ended) with a two-country ground station, a dad in France, and a spacecraft drifting slowly toward a dish that's already pointed at where it's going to be. If you want to see how it turns out, the galleries update themselves, and so, eventually, will this story.
The sky's still broadcasting. I'll keep listening.
Want to build your own?
If any of this made you want to catch a satellite, here's the shortest honest path from nothing to your first image. (The advanced two-site, automation, and projection pieces live in the chapters above and in the companion repo)
Buy the starter hardware (~€60–100). An RTL-SDR Blog V3 dongle with its telescopic dipole kit, and the moment you're past your first attempt, a Nooelec SAWbird+ NOAA LNA (~€50) to mount at the antenna. That's the whole radio.
Build the V-dipole properly. Each arm 53.4 cm, 120° between them, laid flat/horizontal. Give it the most open north–south sky you can. This one step is the difference between a black frame and a real image. (Chapter 2.)
Put the SAWbird at the antenna, not the radio. Power it via the dongle's bias tee. Amplify before the cable loss, never after. (Chapter 3.)
Install SatDump and predict a pass. Use any pass predictor (N2YO, or apps like Look4sat / SDR++'s tracker) to find when METEOR-M2-3 or M2-4 (≈137.9 MHz) next crosses your sky.
Record, then decode. Capture the pass to a raw file, then run SatDump's METEOR LRPT pipeline on it:
   rtl_sdr -f 137900000 -s 2400000 -g 20 pass.raw
   # after the pass:
   satdump pipeline meteor_m2-x_lrpt baseband pass.raw ./decoded \
     --samplerate=2400000 --baseband_format=cu8 --fill_missing
- Expect the first one to be bad. A weak or black first image isn't failure. Iterate. The whole hobby is in the iterating. That's it. Everything else in this article: the automation, the second country, the color, the projection, the timelapse is just what happens when you can't stop asking what if.
Resources & links
- SatDump: decoding/projection Swiss-army knife: satdump.org
- RTL-SDR Blog: dongles, the V-dipole guide, and the best news source for this hobby: rtl-sdr.com
- Nooelec SAWbird+ NOAA: the 137 MHz LNA: nooelec.com
- KrakenRF Discovery Dish: the L-band dish for geostationary/HRPT: krakenrf.com
- N2YO: pass predictions & live tracking (METEOR-M2-3 = NORAD 57166, M2-4 = 59051): n2yo.com
- My galleries: Barcelona: satellite.yannklein.dev · Théding: satellite.sergeklein.com
-
Companion repo (the pipeline, n8n flows, SatDump config, the projection/overlay scripts, and setup notes):
github.com/yannklein/satellite-images/tree/main/docs(going up alongside this article)


Top comments (1)
Nice! Cool use of getting the slow scan images from the satellite.