Yash Shah
When I started setting up centralized monitoring for an organization level. I came across a few of the stacks that attracted me. This post is regarding those who want to start setting up their monitoring can read and get a clear view of what things are indifferent stack and where to approach to set up a perfect "chowkidar 😊😊😊😊" to send anomalies happening over the entire Infra
- Tick Stack
- Prometheus and Grafana
- Sensu
Tick Stack
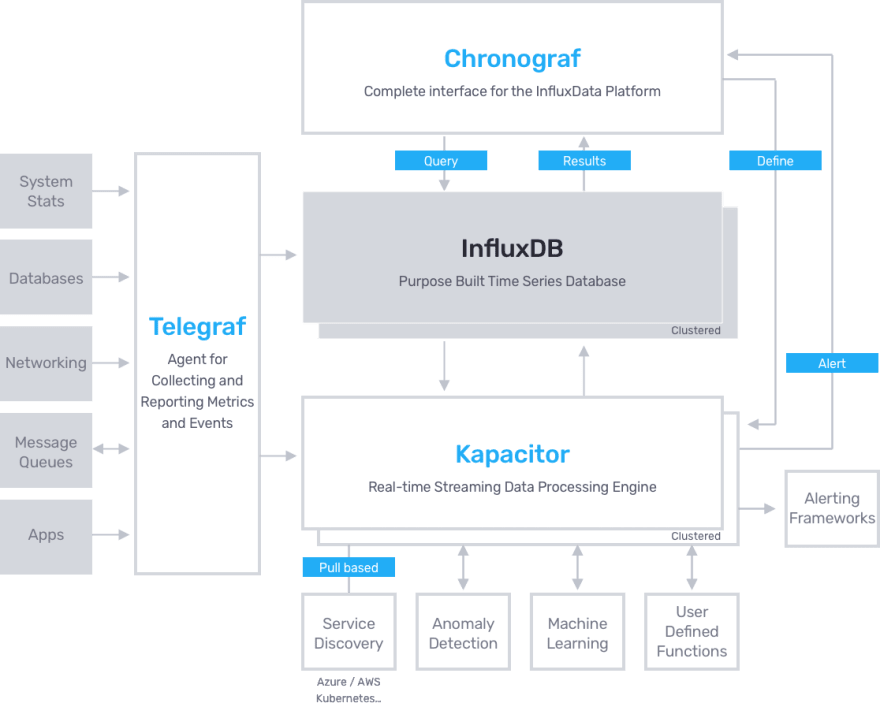
T (Telegraf): Telegraph is an open-source agent that help to collect metrics from server sensor and systems.
I (Influx): Influx DB is a time-series database designed to handle high write and query loads.
C (Chronograf): Chronograf is the user interface and administrative component of the InfluxDB 1.x platform.
K (Kapacitor): Kapacitor is a native data processing engine for InfluxDB 1.x and is an integrated component in the InfluxDB 2.0 platform.
Kapacitor can process both stream and batch data from InfluxDB, acting on this data in real-time via its programming language TICKscript.
Tick uses a more traditional method where agent connects to a central monitoring system, Here the agent (Telegraf) which is a pluggable piece of software and supports multiple inputs and output plugins for specific infrastructure monitoring. Its plugins also allow it to connect to different communication methods like statsD, Nagios Plugins and two-way integration with Prometheus.
TICK is free, easy to install, based on one server/DB combo as the monitoring engine and since it is backed by a company, it also provides Enterprise support and database clustering to those who don’t care to shell out some cache for a complete solution
TICK is both easy to deploy and based on an official DB, it is free an OpenSource.
Prometheus
Prometheus is based on pull-based metrics it means the Prometheus server approaches the open port in agent server for the metrics rather than the agent connecting to the Prometheus server.

Prometheus can also use Tick Stack agent telegraf as an exporter.
Prometheus is easy to install, using one server as the central monitoring system and storage, it has a built-in DB created just for saving monitoring data
For high availability the instruction is to use two different servers, both monitoring the same exporters. Here is where the pull method comes in handy, since the exporters don’t know of the server’s address, any number of servers can connect to them and pull the data. The alerting component has the ability to de-duplicate alert when connected to two servers.
Prometheus is also 100% free which makes it the easiest & cheapest HA monitoring solution in the market.
Sensu
Sensu has been around since the past 2011 and has a noticeable market share of around 7%, its architecture is geared towards massive amounts of data, so it uses RabbitMQ to pipe and buffer the monitoring information between its collectors and it’s the main server.

Sensu has its own collection plugins and supports Nagios plugins as well.
The Sensu servers are built for High Availability out of the box, but they don’t include a DB for storing the data, it uses Redis by default but for storing more than several hours, you will need to include either InfluxDB or ElasticSearch in your installation, both of which will require an enterprise license if you want enterprise features (InfluxDB charges for clustering, ElasticSearch charges for security)
In Sensu alerts are called checks, and creating one involves creating a cron job and configuring a JSON file which tells it what ruby script to run, what statistic to check (including some calculations) and whom to notify. It doesn’t seem as straight forward as the other solutions.
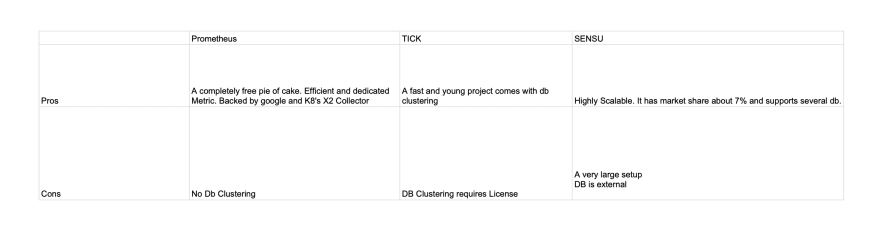
For a free solution i would definitely go with prometheus, if DB clustering is a specific requirement TICK is your solution, both of them are easy to install with a helm script and some tinkering. for creating nice dashboards, there is no dilemma Grafana is the absolute best and while TICK still develops it’s own UI (Chronograf), all of them integrate with it

Top comments (0)