Hi, I normally contract in MSBI, SQL, Data Arcitecture, Oracle, .Net/.Net Core, API development, React, focusing on www.cryptostatto.com at the moment. Reach out if you see any synergy.
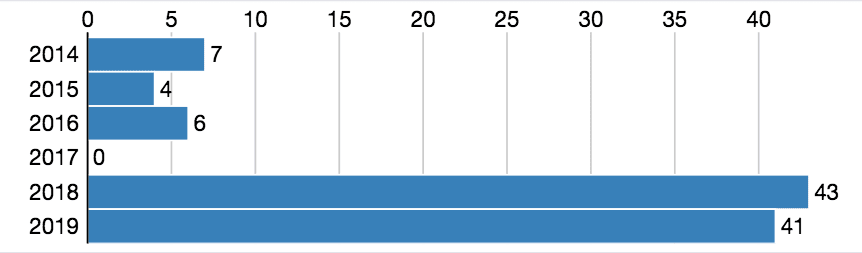
Thanks for sharing your experience. Bit of random advice, the chart you provided, you could have plotted multiple data series on the same axis as a stacked bar chart. This would let you show total applications per year by total successes.
I agree in terms of showing “interview conducted” or not, but is 4 interviews better or worse than a company that hosts maximum of 2 before making a decision? That doesn’t reflect my success/failure as much as company policy
I created a stacked bar-chart, see before/after
Before
and after, using codepen for interactivity
Awesome, well done :D