Without data, you're just another person with an opinion.
In today’s digital world, businesses generate massive amounts of data. But data alone is meaningless unless analyzed and converted into actionable insights. This is where Data Analytics plays a crucial role.
From predicting customer behavior to optimizing supply chains, Data Analytics helps organizations make smarter, data-driven decisions. Let’s dive into what Data Analytics is, its key components, and how it is shaping industries worldwide.
What is Data Analytics?
Data Analytics is the process of examining raw data to identify trends, patterns, and valuable insights that aid in decision-making. It involves:
✔ Collecting & Cleaning Data – Ensuring accuracy and removing inconsistencies.
✔ Exploratory Data Analysis (EDA) – Discovering patterns and relationships in the data.
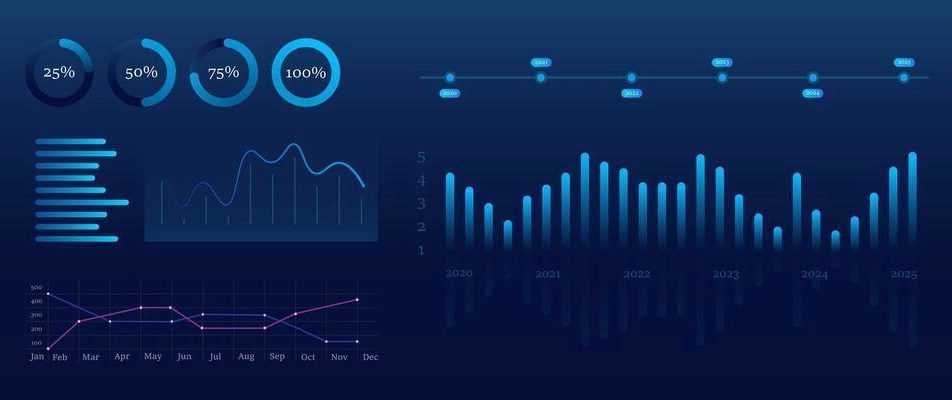
✔ Data Visualization – Presenting data through graphs and dashboards.
✔ Predictive Analytics – Forecasting future trends using machine learning models.
For a deeper understanding of Data Analytics fundamentals, check out
Kaggle's Free Courses and Google’s Data Analytics Certification
Types of Data Analytics
🔹 Descriptive Analytics – Answers "What happened?" (e.g., past sales trends).
🔹 Diagnostic Analytics – Answers "Why did it happen?" (e.g., reasons for customer churn).
🔹 Predictive Analytics – Answers "What will happen next?" (e.g., sales forecasting).
🔹 Prescriptive Analytics – Answers "What should be done?" (e.g., recommending inventory stock
Essential Skills for a Data Analyst
To succeed in Data Analytics, mastering these skills is key:
📌 SQL – Querying databases and handling large datasets.Learn SQL for free at Mode Analytics SQL Tutorial
📌 Python / R – Data manipulation and analysis. Start learning Python at Real Python or DataCamp.
📌 Excel – Basic statistical analysis and pivot tables. Check out for .
📌 Data Visualization – Creating dashboards using Power BI, Tableau, or Matplotlib. Explore for free visualization tools.
📌 Statistics & Probability – Understanding trends, correlations, and hypothesis testing. Learn from .
Tools Used in Data Analytics
SQL – Extracting and managing structured data.
Python & Pandas – Data cleaning and analysis.
Tableau & Power BI – Building interactive reports.
Google Analytics – Web traffic and user behavior analysis (Google Analytics).
Excel – Quick calculations and data summaries.
💡 Final Thoughts
With businesses becoming more data-driven, the demand for Data Analysts is soaring across industries. Whether you're just starting or looking to upskill, learning Data Analytics can open doors to exciting career opportunities.
👉 What’s your favorite tool or technique in Data Analytics? Let’s discuss in the comments!

Top comments (0)