
Introduction
As a tester, your role is crucial in ensuring the quality and functionality of web applications. One indispensable tool at your disposal is the Network tab in your browser’s developer tools. This powerful feature enables you to monitor and manipulate network requests, analyse performance, and detect potential issues. In this article, we will explore some key hacks for testers, empowering you to make the most of the Network tab and enhance your testing capabilities.
Understanding the Network Tab
The Network tab is a part of the developer tools provided by modern web browsers. To access it, simply right-click anywhere on a webpage, select “Inspect” or “Inspect Element,” and navigate to the “Network” tab.

This tab displays all the network requests made by the web page, including HTTP requests, responses, and associated details.
Monitoring Network Requests & Analysing Performance
By monitoring network requests, you gain valuable insights into the behaviour and performance of a web application. The Network tab displays various columns, such as URL, status code, size, and timing, enabling you to track individual requests. You can filter requests based on specific criteria, such as file type or response code, to focus on relevant data.
The Network tab also allows you to evaluate the performance of web pages and identify potential bottlenecks. By examining the timing information, you can pinpoint requests that contribute to slow loading times. Look for requests with long “Waiting” or “Content Download” times, which may indicate areas for optimisation. Additionally, the waterfall view provides a visual representation of request timings, aiding in performance analysis.

Inspecting Request and Response Headers
Request and response headers contain vital information exchanged between the client and the server. In the Network tab, you can inspect headers to understand how requests are made and how servers respond. This is particularly useful when testing APIs or troubleshooting authentication issues. Look for specific headers, such as “Authorisation” or “Content-Type,” to ensure correct configurations.

Manipulating Requests
The Network tab empowers testers to manipulate network requests, enabling them to simulate different scenarios and edge cases. For example, you can modify request headers, such as User-Agent or Referer, to mimic different user agents or referrers (also called user-agent spoofing). You can also modify request payloads or parameters to test specific conditions or validate input sanitisation. These manipulations help uncover vulnerabilities and assess the resilience of the application.

Capturing Network Traffic
In certain testing scenarios, capturing network traffic becomes essential for thorough analysis. The Network tab allows you to save all requests and responses as a HAR (HTTP Archive) file. This file contains a detailed record of the network activity, including headers, timings, and content. By capturing network traffic, you can reproduce issues, share findings with developers, or preserve evidence for further investigation.

Simulating Network Conditions
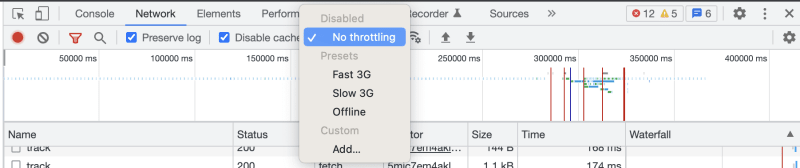
Testing under different network conditions is crucial to ensure optimal performance across various environments. The Network tab provides built-in options to simulate network conditions, such as throttling the network speed or introducing latency. By mimicking slow or unreliable network connections, you can observe how the application behaves in real-world scenarios and address any performance issues accordingly.
Leveraging Performance Analysis Tools
To initiate performance recording, simply click the “Measure page load” button in DevTools. The page will reload, and the recording will automatically stop a few seconds after the page has finished loading.

Among the standout functionalities of Performance Insights, the playback feature stands out as one of the most remarkable. It enables you to not only replay the entire performance recording but also delve into specific moments within the record by zooming in.

What amplifies its effectiveness further is its seamless alignment with the tasks being carried out by the browser in real-time, such as network requests and rendering. This visual correlation enhances the overall power and usability of the feature.
Conclusion
The Network tab in your browser’s developer tools is an essential tool for testers, offering a wide range of features to analyse, monitor, and manipulate network requests. By mastering its capabilities and implementing the hacks discussed in this article, you can enhance your testing skills, uncover hidden issues, and contribute to the overall quality of web applications.
By embracing the power of the Network tab and continuously acquiring new skills, you become an invaluable asset in ensuring the quality and functionality of web applications. Unlock a world of possibilities for comprehensive and effective testing. Happy testing!
If you liked this, click ❤ so other people will also notice here.

Top comments (0)