Introduction
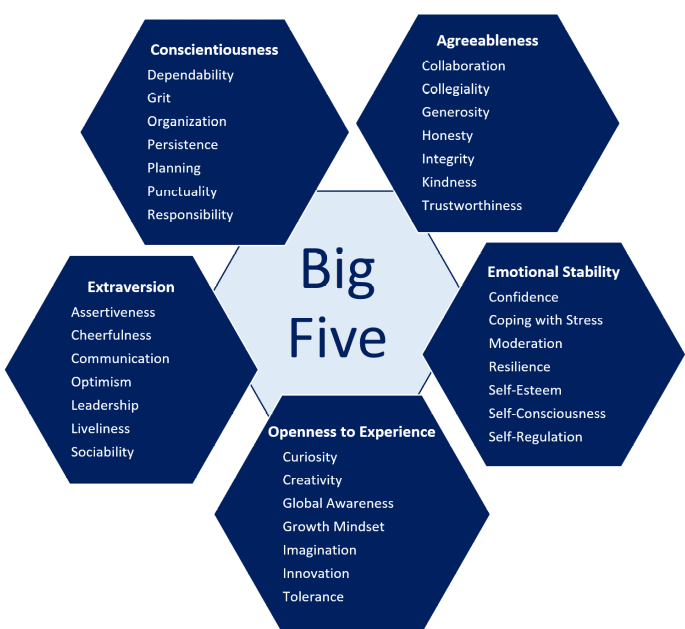
Human behavior is of tremendous importance of tracking behavior from daily life behavior to tracking possibility of diseases. It is currently a hot topic in research domains to enhance user experience based on their behavior. World wide web needs some sort of markers to suggest content based on user personality type. The Big Five personality model has been the most successful empirical model to analyze personality of an individual. We can segregate users based on their personality type by asking questions that are curated based on years of tested research in the domain of psychology. There are five baseline traits that the model identifies and attribute some characteristics associated with these traits. Traits are:
1. Contentiousness
2. Openness
3. Extraversion
4. Agreeableness
5. Neuroticism
Why Super-Grouping?
Tracking human behavior from patterns found in questionnaires is a tedious job. But, years of research in psychology have made it possible to extract patterns. Grouping these outcomes is another job. From common sense, we know that we are all distinct in our behavior, but we share a lot of common behavioral patterns and yet we only focus on tiny differences. We can be still grouped together on the basis of similar patterns. Big 5 just provide us with an empirical scale to map patterns of behavior.
Methodology
It is a problem of clustering. We can group user base based on their scores in each trait. The scale we are going to use is “International Personality Item Pool – FFM (IPIP-FFM)-50” which consists of 50 questions which add value to these traits. The end result gives us scores in these traits. The dataset we are going to use is IPIP-FFM-data-8Nov2018.
The Machine learning algorithm in use is going to be unsupervised clustering which will segregate user-base based on their Euclidian distance from their trait scores. The problem at hand is whether we can segregate user-base using predetermined KNN algorithm where K has to be identified. But, the research doesn’t point to a fixed value of K. There could be another approach of X-Means algorithm where cluster itself defines the number of clusters based on appropriate differentiation. The scale used to score items is from the official ipip.ori.org website https://ipip.ori.org/newBigFive5broadKey.htm.
Jupyter Notebook and Python
Jupyter makes it easy to break the code into chunks of functional code with meaningful incremental data output. Python libraries uses are
• scikit-learn from Google
• numpy for linear algebra
• matplotlib for plotting 2D graphs
• seaborn for high level visualization
• os for directory read/write ops
• yellowbricks for distortion score visualization
Rest of the python code from Jupyter notebook is attached with the project files.
Demonstration
First, we had to open the csv file and cleanse the data with partial entries, so that we could perform operations on complete dataset only. The number of participants after this operation were 1013481.
Then we plotted users from their respective countries on the graph. Users on y-axis and countries on x-axis:

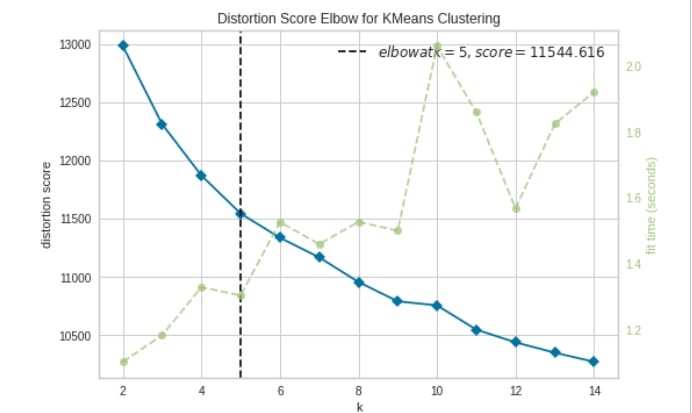
Using sklearn to form clusters and yellowbricks to visualize the results of cluster distortion for different values of K (from 2 to 15). As the graph below shows the best value is 5 for K
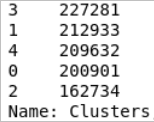
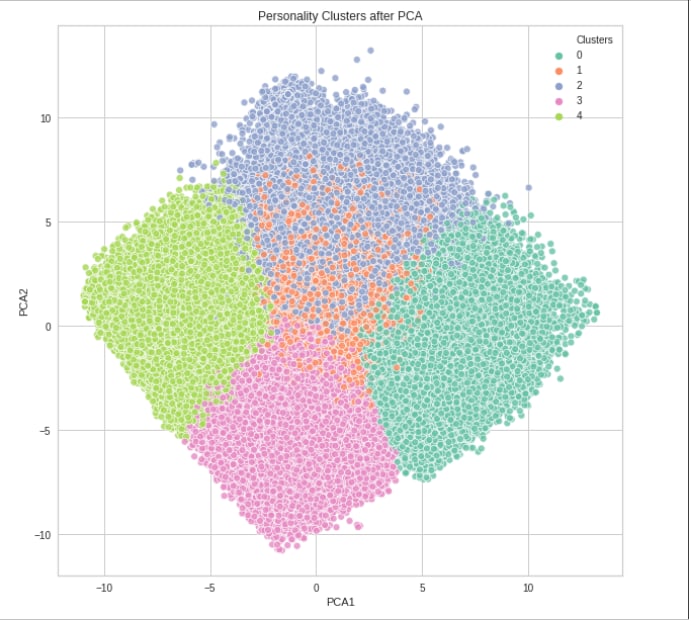
Using K=5 for personality clusters, we that started to train our model by inserting the dataset to K-Means clustering algorithm. At the end we get users from different ranges into their cluster group.

Number of unique users in each cluster.
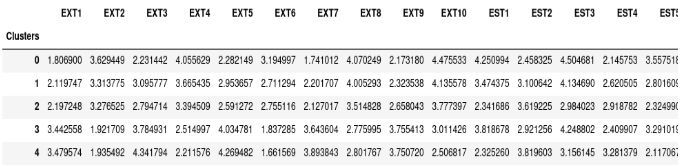
Average psychometric scores for each cluster
Visual representation of range of average scores for 5 psychometric 5 traits for each cluster.

Dispersion of Traits scores for users in each cluster.
Conclusion
These graphs with dispersion and average trait scores tell us that we can group users based on similar behavioral patterns for each scenario from daily life. Apart from the research in personality literature that sees each psychometric as an individual maker to group users, but converting it into a clustering problem tells us that range of 5 trait scores is better suited to group user base. It draws better distinction with full mapping of user behavior rather than mapping individual trait. From that we can segregate user base for purposes like recommendation systems etc. Each cluster reflects a particular behavior-system regards to shopping trends, movie liking etc. which is quite popular now a days as a research problem.

Top comments (0)