
In my previous posts on Modding My Rowing Machine, I wired up an Arduino to my rowing machine, and streamed the speed sensor data to an ASP.NET core application.
In this post, I’m going to show you how to take sensor and counter data, push it to a browser as it arrives, and display it in a real-time chart.
If you want to skip ahead, I’ve uploaded all the code for the Arduino and ASP.NET components to a github repo at https://github.com/alistairjevans/rower-mod.
I’m using Visual Studio 2019 with the ASP.NET Core 3.0 Preview for all the server-side components, but the latest stable release of ASP.NET Core will work just fine, I’m not using any of the new features.
Pushing Data to the Browser
So, you will probably have heard of SignalR, the ASP.NET technology that can be used to push data to the browser from the server, and generally establish a closer relationship between the two.
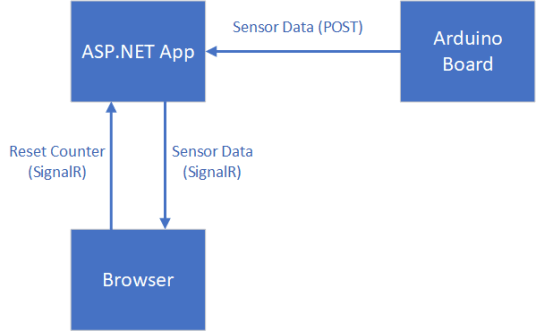
I’m going to use it send data to the browser whenever new sensor data arrives, and also to let the browser request that the count be reset.
The overall component layout looks like this:
Setting up SignalR
This bit is pretty easy; first up, head over to the Startup.cs file in your ASP.NET app project, and in the ConfigureServices method, add SignalR:
Next, create a SignalR Hub. This is effectively the endpoint your clients will connect to, and will contain any methods a client needs to invoke on the server.
SignalR Hubs are just classes that derive from the Hub class. I’ve got just the one method in mine at the moment, for resetting my counter.
Before that Hub will work, you need to register it in your Startup class’ Configuremethod:
You’re also going to want to add the necessary SignalR javascript to your project. I did it using the “Manage Client-Side Libraries” feature in Visual Studio; you can find my entire libman.json file (which defines which libraries I’m using) on my github repo
Sending Data to the Client
In the MVC Controller where the data arrives from the Arduino, I’m going to push the sensor data to all clients connected to the hub.
The way you access the clients of a hub from outside the hub (i.e. an MVC Controller) is by resolving an IHubContext<THubType>, and then accessing the Clients property.
Pro tip:
Got multiple IO operations to do in a single request, that don’t depend on each other? Don’t just await one, then await the other; use Task.WhenAll, and the operations will run in parallel.In my example above I’m writing to a file and to SignalR clients at the same time, and only continuing when both are done.
Browser
Ok, so we’ve got the set-up to push data to the browser, but no HTML just yet. I don’t actually need any MVC Controller functionality, so I’m just going to create a Razor Page, which still gives me a Razor template, but without having to write the controller behind it.
If I put an ‘Index.cshtml’ file under a new ‘Pages’ folder in my project, and put the following content in it, that becomes the landing page of my app:
In my site.js file, I’m just going to open a connection to the SignalR hub and attach a callback for data being given to me:
That’s actually all we need to get data flowing down to the browser, and displaying the current speed and counter values!
I want something a little more visual though….
Displaying the Chart
I’m going to use the ChartJS library to render a chart, plus a handy plugin for ChartJS that helps with streaming live data and rendering it, the chartjs-plugin-streaming plugin.
First off, add the two libraries to your project (and your HTML file), plus MomentJS, which ChartJS requires to function.
Next, let’s set up our chart, by defining it’s configuration and attaching it to the 2d context of the canvas object:
Finally, let’s make our chart display new sensor data as it arrives:
With all that together, let’s see what we get!

Awesome, a real-time graph of my rowing!
As an aside, I used the excellent tool by @sarah_edo to generate a CSS grid really quickly, so thanks for that! You can find it at https://cssgrid-generator.netlify.com/
You can check out the entire solution, including all the code for the Arduino and the ASP.NET app, on the github repo at https://github.com/alistairjevans/rower-mod.
Next up for the rowing machine project, I want to put some form of gamification, achievements or progress tracking into the app, but not sure exactly how it will look yet.

Top comments (0)