
This is the final article of the series Live tweet sentiment analysis. In the previous article, we saw how to create an API to serve our predictions. This article will cover how to build a frontend.
Normally, frontends are written in Reactjs or Vuejs(these are the only ones I know). But I'm a big fan of Python and I would like to build the frontend using python. Streamlit helps you build quickly an interface to serve your machine learning apps.
Even though the backend isn't necessary here(streamlit could've handled the prediction part also), it is important to shift the heavy-duty task to a backend that can spawn multiple workers(
gunicorninstead ofuvicorn) and implement better job-queuing and async methods.
Building the frontend
make sure you are in frontend directory
Streaming the hashtags
# tweets.py

import tweepy as tw

auth = tw.OAuthHandler(config.consumer_key, config.consumer_secret)
auth.set_access_token(config.access_token, config.access_token_secret)
api = tw.API(auth, wait_on_rate_limit=True)

tweets = tw.Cursor(api.search, q=hashtag, lang="en", since=date).items()
tweets object will hold the stream of tweets retrieved from twitter since the date given.
Building the UI
# tweets.py

import streamlit as st

st.title("Twitter Live Sentiment Visualizer (beta)")

# design the sibar elements
st.sidebar.title("Enter a hashtag")
hashtag = st.sidebar.text_input("hashtag", "trump")
date = st.sidebar.date_input("Analyse tweets from", datetime.date(2020, 8, 1))

# if "Live analysis" is clicked
if st.sidebar.button("Live analysis", key="analyse"):
    pos_count = 0
    neg_count = 0
    tweets_count = 0

    st.subheader(f"Analysing #{hashtag} from {date}")
    d = {"Positive": [pos_count], "Negative": [neg_count]}
    df = pd.DataFrame(data=d)

    hashtag = f"#{hashtag}"

    # get the tweets
    with st.spinner("Getting tweets..."):
        tweets = tw.Cursor(api.search, q=hashtag, lang="en", since=date).items()

    total_tweets = st.empty()
    pos_tweets = st.empty()
    neg_tweets = st.empty()

    sentiments = ["Positive", "Negative"]
    chart = st.line_chart(df)

    # iterate through all the tweets
    for idx, tweet in enumerate(tweets):
        tweets_count += 1
        output = requests.post("http://backend:8000/api", json={"tweet": tweet.text})
        output = output.content.decode("utf8")
        output = json.loads(output).get("sentiment")

        # count the number of each sentiment
        if output == "Negative":
            neg_count += 1
        elif output == "Positive":
            pos_count += 1

        total_tweets.text("Tweets Analysed: %d" % tweets_count)
        pos_tweets.text("Positive tweets: %d" % pos_count)
        neg_tweets.text("Negative tweets: %d" % neg_count)

        # update the DataFrame
        df2 = pd.DataFrame({"Positive": [pos_count], "Negative": [neg_count]})
        df.update(df2)
        # draw the cumulative chart
        chart.add_rows(df)

    if neg_count == 0 and pos_count == 0:
        st.warning(f"No Tweets Found on {hashtag}")
    else:
        st.success("Tweets classified")
Basically what this does is get the tweets from twitter API, send it to the backend for inference and plot the cumulative of each sentiment. You could even change this to a seven tweets moving average😉. One important thing to notice is that
output = requests.post("http://backend:8000/api", json={"tweet": tweet.text})
we used backend:8000 instead of localhost:8000. This is because the service that we build for the backend will be called backend and the host will be backend instead of localhost
Dockerize the frontend
FROM python:3.8-slim

WORKDIR /app

COPY requirements.txt .

RUN pip install -r requirements.txt

EXPOSE 8501

COPY . .

CMD ["streamlit", "run", "tweets.py"]

# nothing fancy here
Now let's bind everything to build our app
cd .. to move back to the root directory. Your project structure should look like this.
❯ tree .
.
├── LICENSE
├── README.md
├── backend
│   ├── Dockerfile
│   ├── classify.py
│   ├── models
│   │   └── sentiment_model.pickle
│   ├── requirements.txt
│   ├── server.py
│   └── utils.py
├── docker-compose.yml
└── frontend
    ├── Dockerfile
    ├── config.py
    ├── requirements.txt
    └── tweets.py
Docker-compose
Create a docker-compose.yml in the root directory
version: "3"
services:
  frontend:
    build: frontend
    ports:
      - "8501:8501"
    depends_on:
      - backend

  backend:
    build: backend
    ports:
      - "8000:8000"
- version: Compose file version 3
- services: here we define the services(frontend and backend)
- depends_on: since frontend depends on backend
❯ docker-compose build
❯ docker-compose up -d
Starting sentwitter_backend_1 ... done
Starting sentwitter_frontend_1 ... done
# -d for detach mode (it'll run in background)
Navigate to localhost:8501 and you should see your app running. Let's do a quick run on #2Articles1Week.
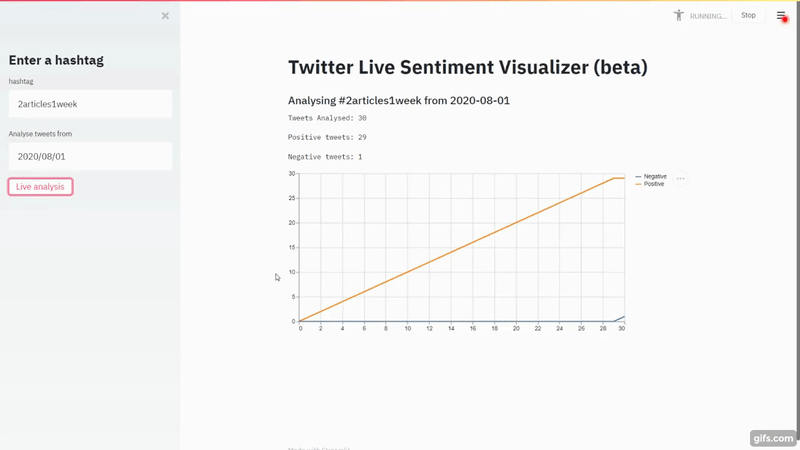
That's a lot of red flags right there for the model. Nobody will write negatively about
2articles1week. It's just the model is so bad.
Reference
- Article cover by Patrick Tomasso

Latest comments (0)