Most of the applications and sites we use today are bound to show location and various data on maps. Maps are used everywhere: from food delivery sites to online stores and complex applications for logistics companies.
Maps are used very widely in web design, and when presenting data, we usually expect them to be interactive. It can be the branches of an international company, statistics about countries or just destinations to visualize.
Maps that are pre-arranged help people find your business without having to spend time looking for your physical location manually.
One way or another, while developing another application you will definitely face the questions of working with maps. What tools should you use? Paid or open-source? Standalone or web-based?
Many different plugins and libraries that you will find on our list are built specifically to make it easy for people to find your business.
But Google Maps isn’t the only solution. Firstly, it does not provide too many customization options, such as custom marking and adding extra widgets to make your maps more interactive. Other than that, you might need maps specifically for contests, exploration, traveling, hiking, and much more. That’s why you may need open-source solutions.
In this article-comparison we will talk about different types of javascript tools for working with maps. We’ll look at the types of tools you can choose from, as well as the comparison options.
Classification of javascript solution for maps
Due to a large number of different tools for working with maps, it would be good to categorize them to give a definition of each category.
In this article, the categories for Web mapping clients have been extracted from the projects’ descriptions. Thus, there are libraries, wrappers, toolkits, frameworks, and clients.
- Libraries: Expose classes and functions allowing to build applications at a higher level of programming;
- Wrappers: act as an interface between its caller and the wrapped code;
- Toolkits: more modular and easily integrated into a custom application;
- Frameworks: A reusable software template, or skeleton, from which key enabling and supporting services can be selected, configured and integrated with application code;
- Clients: ready-to-use Web mapping applications.
This way of categorizing Web mapping clients provides a first approach for distinguishing them, so you could select more easily.
The comparison
The comparison is presented in three parts to facilitate the reading:
- General description: Gives an introduction to each project;
- Technical features: Presents some technical data on each project;
- Links of interest: Includes a screenshot showing how the client looks like as well as links to useful pages and live demos.
How to choose the right solution?
So, which mapping framework should you choose? It depends on what features you need and how much you want to customize your map.
In this section, we will take 2 products as a base for questions on how to choose a tool for work with maps. These are Google Maps and Leaflet – the most popular tools that reflect the 2 types of solutions to the question of choosing a tool for working with maps. Most users will be well served by simply choosing one of these two.
First of all, you need to start with a question – Do I Even Need A Mapping Framework? If you need something set up quickly, have no custom data and default map themes are OK for you – simply use an embedded map like the Bing one to the left. Google, Bing and others offer options to embed a map.
Either of these choices (embedding or using a plugin) will meet only the most basic of mapping needs. If your use case fits within what they offer, then I encourage you to use them. When your mapping needs get more complex, you will need to switch to using an actual mapping framework.
When you choose the tool for maps apart of the technical classification, you will have to choose from Paid or Open-source solutions.
Both paid and open-source ones are good and reliable mapping frameworks and there are a lot of good things they can do. Choosing between the two types will require consideration of several factors.
The Google Maps API is created and maintained by Google. All updates, improvements and rules regarding its use come from Google. All free tier implementations must be publicly available – intranet usage and maps behind a paywall require a premium plan.
Leaflet is an Open Source project, like WordPress, and there are fewer restrictions on its use. You can use it behind a paywall or on an intranet, use it for unlimited map views (though your base map provider may have its own limitations), remove or customize the branding and more.
Let’s move to the next question you will ask when choosing the solution for your business.
Releases and Upgrades
Since Google controls the Google Maps API, they determine the release schedule and when new features are added. They also determine when older versions of the code will be retired. For the most part it’s a good thing. It means most websites will be using the same version of the API and that developers using the Google Maps API will be familiar with exactly what options are available.
With Leaflet, upgrades are more frequent and incremental, new releases are made as new features are available. The plugin updates are also independent of the map updates, so additional improvements may come through those channels too. Or, if you’ve got a Leaflet map you’re happy with, you can copy the map code to your own server and keep using an older version for as long as you want – you aren’t forced to upgrade.
Support Options
If you’re using the free tier of Google Maps, then you could check out their community support site. If you are a paid plan Google Maps API user, you will have other support options available to you, including a hotline you can call.
For Leaflet, there is active community support on StackExchange, StackOverflow and on GitHub, where the project code is hosted.
Tools and libraries for maps
Some of these map tools can really reduce the amount of effort needed to produce interactive maps. Many of these tools allow you to implement all kinds of dynamic maps with just a few lines of code.
Here are the JS libraries you can use to show special map markers, draw custom route lines or even show a dialog when you hover or click on certain points of the map.
Personalize your maps in the style that you want – some of them can be styled with CSS – or customize your map to be as interactive as you like. The source of the map data, dependencies and licenses of each library have been included for your convenience.
For this roundup, we have chosen some of the Best JavaScript Libraries for creating interactive maps for your web applications. The following libraries provide a myriad of functions and features that help developers to create complex maps easily and quickly.
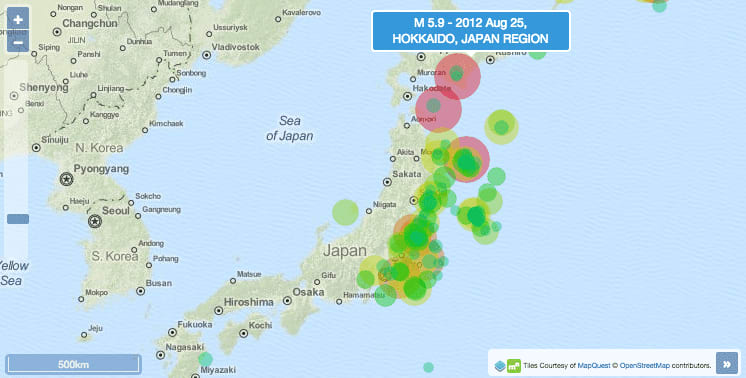
Leafletjs
Web-site: https://leafletjs.com/
GitHub stars: 28.1k, https://github.com/Leaflet/Leaflet/
Pricing: Free
Map Data Source: OpenStreetMap
Dependencies: None
License: BSD 2-Clause “Simplified” License
Category: Library
Examples/Demo/Gallery: https://leafletjs.com/examples.html

Leaflet is one of the best open-source JavaScript libraries for creating mobile-friendly interactive maps. It is relatively small with a ton of features, plugins, straightforward API, and it works across all browsers and platforms. Here are some Leaflet.js demos.
Its basic library is fairly small, making Leaflet a great option for mobile applications or other situations in which load time or size is at a premium. It also has a ton of available plugins meaning you can add on just about any functionality available with a heftier mapping library.
It is also supported by some of the leading companies in the world; GitHub, Flickr, Facebook, Etsy and many more. Because it’s an open-source project, community members are welcome to contribute to the repository and make it even greater than it already is.
Leaflet also has a strong documentation project behind it, making it a good choice for beginners, and there are a number of community-contributed examples out there on the Internet for when you get stuck, as well as many examples on the project homepage.
Openlayers
Web-site: https://openlayers.org/
GitHub stars: 7.1k, https://github.com/openlayers/openlayers
Pricing: Free
Map Data Source: OpenStreetMap
Dependencies: None
License: 2-Clause BSD
Category: Library
Examples: https://openlayers.org/en/latest/examples/
OpenLayers is a high-performance open-source JavaScript framework to build interactive maps using various mapping services. You can choose the map layer source using a tiled layer or vector layer from a number of map services.
The product comes mobile-ready out of the box, suitable for building maps across devices and browsers. You can use CSS for a different look at your map. To implement the map on your web using OpenLayers, here’s a tutorial that will help.
OpenLayers is also capable of rendering vector data from GeoJSON, TopoJSON, KML, GML and other geographic data formats.
The documentation for OpenLayers is well organized and provides a lot of information for developers. A gallery on the OpenLayers website contains a large selection of live demos, and quite a few code samples are available on GitHub.
Mapbox
Web-site: https://www.mapbox.com/
GitHub stars: 6.1k, https://github.com/mapbox/mapbox-gl-js
Pricing: Free, starts from $2.40 for 1000 loads
Map Data Source: Mapbox
Dependencies: None
License: Mapbox copyright
Category: Web Application
Examples: https://docs.mapbox.com/mapbox-gl-js/examples/

Mapbox is one of the most advanced mapping solutions on the web right now. It is built for developers by experienced developers themselves. It gives easy to use set of tools for creating beautiful web and mobile maps. It offers users full control over map styling (including background map) and has a lot of cool additional services such as satellite images and geocoding or directions.
The Mapbox platform features textures, illustrations, custom markers, vector tiles, static maps, geocoding and more. Mapbox offers five plans, ranging from a free starter plan to a high-volume enterprise plan.
The platform also features Mapbox Editor, an online editor that allows users to quickly build custom maps using their own data. Data can be imported from a spreadsheet file (CSV), GeoJSON, KML or GPX. The documentation is well-designed and easy to follow.
Google Maps API
Web-site: https://developers.google.com/maps/documentation
GitHub stars: –
Pricing: Free, starts from $2 for per 1000 requests loads in static maps
Map Data Source: Google
Dependencies: None
License: Google copyright
Category: Web Application
Examples: https://developers.google.com/maps/documentation/javascript/examples

Google Maps is a safe choice for anyone, whether an inexperienced webmaster or an advanced developer. It has been around for long enough to have established themselves as the leaders in mapping industry. To add to that, JavaScript API makes it easy to integrate Google Maps into any application, service or website you desire. Moreover, WordPress users will be able to find plenty of plugins to support Google Maps on their site, all of which use the API to deliver end result.
Datamaps
Web-site: https://datamaps.github.io/
GitHub stars: 3.4k, https://github.com/markmarkoh/datamaps
Pricing: Free
Map Data Source: D3.js
Dependencies: D3.js and TopoJSON
License: MIT License
Category: Library
Examples: https://datamaps.github.io/

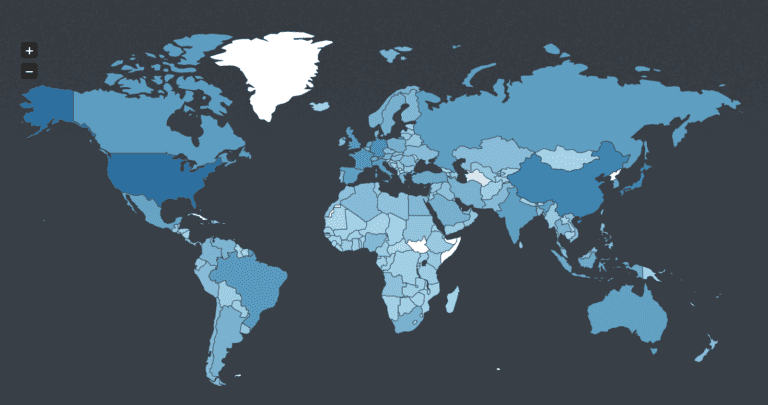
DataMaps – interactive maps for data visualizations bundled into a single Javascript file. It is SVG-based, can be scaled to any screen size and relies heavily on D3.js. It comes with ready-to-use maps for world map with countries, USA with states and a combined one. The map data is stored as JSON and any custom maps can be created by following the structure.
Jvectormap
Web-site: http://jvectormap.com/
GitHub stars: –
Pricing: From $39
Map Data Source: jVectorMap
Dependencies: jQuery
License: GNU GPL, paid
Category: Library
Examples: http://jvectormap.com/examples/world-gdp/
jVectorMap is an open-source library for interactive maps that requires jQuery. jVectorMap has quite a small API reference and does not feature Documentation as we know it, but there is a concise Getting Started tutorial which is still very helpful.
jVectorMap uses only native browser technologies like JavaScript, CSS, HTML, SVG or VML. No Flash or any other proprietary browser plug-in is required. This allows jVectorMap to work in all modern mobile browsers.
Bing Maps
Web-site: https://www.microsoft.com/en-us/maps/choose-your-bing-maps-api
GitHub stars: –
Pricing: Free, custom (on request)
Map Data Source: Bing Maps
Dependencies: None
License: Microsoft copyright
Category: Web Application
Examples: https://docs.microsoft.com/en-us/bingmaps/v8-web-control/index

Microsoft Bing Maps is a very popular mapping platform. Microsoft is steadily working on adding new features and improvements to the Bing Maps Platform.
There is a nice AJAX Interactive SDK that provides feature samples and code snippets for developers building JavaScript applications. The Bing Maps platform provides multiple API options for applications including Web Control, a Windows Store apps control, a WPF control, REST Services, and Spatial Data Services.
Amcharts Map Chart
Web-site: http://www.amcharts.com/javascript-maps/
GitHub stars: –
Pricing: Free, from $90
Map Data Source: amCharts
Dependencies: None
License: Amcharts copyright
Category: Library
Examples: https://www.amcharts.com/demos/#maps

amMap is a special JavaScript (HTML5) library for maps developed by amCharts. It has no external dependencies and allows you to build beautiful choropleths, bubbles, dots (or points), connectors and flow maps quite easily, as well as supporting multiple utile interactive features.
The tool can be used to show locations of offices, routes of journeys, create distributor map, etc. The product offers a number of features: it lets you use photos or images as layers and backgrounds, as well as highlight location and routes.
Kartograph
Web-site: http://kartograph.org/
GitHub stars: 1.5k, https://github.com/kartograph/kartograph.js
Pricing: Free
Map Data Source: Kartograph
Dependencies: Kartograph.py, Raphael, and jQuery
License: AGPL and LGPL
Category: Framework
Examples: http://kartograph.org/showcase/

Kartograph is a simple and lightweight framework for generating SVG maps without any other mapping services. Kartograph.js is a JavaScript library for creating interactive maps based on Kartograph SVG maps. It is built on top of Raphael and jQuery and it gracefully degrades to Internet Explorer 7+.
There is no ready-to-use map collection in Kartograph, but the library works with any SVG maps, also offering a utility named Kartograph.py to create maps.
While Kartograph is not dependency-free requiring both Raphael JS (used for drawing) and jQuery, it provides you with smooth mapping experience, whereas the library documentation and API reference (combined in a single article) allow you to get interactive maps up and running in your projects in quite a nice and easy manner.
ArcGIS
Web-site: https://developers.arcgis.com/
GitHub stars: –
Pricing: Free, from $125 monthly
Map Data Source: Esri
Dependencies: None
License: Esri copyright
Category: Framework
Examples: https://developers.arcgis.com/javascript/3/jssamples/

ArcGIS API for JavaScript – a lightweight way to embed maps and tasks in web applications. It comes with a ton of features, samples, bundled widgets and templates. Here is a good ArcGIS Boilerplate.
Esri has a really nice portal for developers that is well-designed and easy to follow. The developer portal includes access to ArcGIS APIs and SDKs, good documentation, live demos, code samples and more. Esri offers standalone developer pricing that uses a credit system (for developers who do not have an ArcGIS online subscription).
Esri technology is used by more than 350,000 organizations worldwide, and over two-thirds of them are Fortune 500 companies.
Zeemaps
Web-site: https://www.zeemaps.com/
GitHub stars: –
Pricing: Free, from $19.95 per month
Map Data Source: –
Dependencies: None
License: Zeemaps copyright
Category: Web Application
Examples: https://www.zeemaps.com/mobile?group=1971477
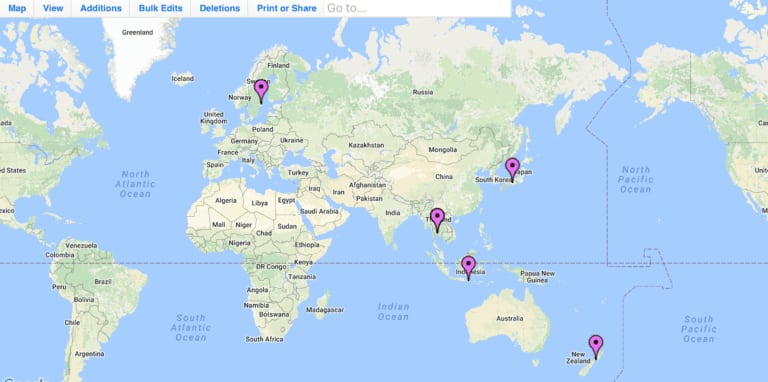
ZeeMaps is an enterprise-class mapping service that allows you to easily create, publish and share interactive maps. You can construct dynamic visualizations of geographic information, producing maps from your list of people or places. For example, you can create a map of places you have visited, or maps that mark the addresses of your customers, sales leads, friends and relatives. All maps are stored on their own servers and can be instantly accessed at any time, anywhere, from any standard Web browser on a computer or mobile device.
All maps can be crowdsourced for additions. That makes it a very reliable platform to use between groups of people. Other features also include grids, icons, markers and custom fields.
This is a tool that is tailored for specific types of interactive maps – it is wonderful at letting you create, publish and share maps for presentation or geoanalysis. It offers the kind of features that most others on the list do. In addition, it makes it easier for you to get inputs for the map from different sources and set up 3-level access for the maps.
Anymap by Anychart
Web-site: https://www.anychart.com/products/anymap/overview/
GitHub stars: –
Pricing: From $49
Map Data Source: Anychart
Dependencies: None
License: Anycharts copyright
Category: Library
Examples: https://www.anychart.com/products/anymap/gallery/

AnyMap is one of popular JavaScript (HTML5) charting libraries created by AnyChart. Just like amMap, it requires no big efforts to build a map using it as well as no external resources or third-party libraries such as jQuery. AnyMap also supports all basic types of maps you might need – choropleth, bubble, dot, connector and flow maps.
The list of key interactive features of AnyMap includes drill-down for region-specific insights, events model for processing map viewer actions, and color scale for automatically coloring a map according to your settings instead of doing that manually.
Highmaps by Highcharts
Web-site: https://www.highcharts.com/products/highmaps/
GitHub stars: 9.5k, https://github.com/highcharts/highcharts
Pricing: Free and paid (From $722)
Map Data Source: Highcharts
Dependencies: jQuery
License: Highcharts copyright
Category: Library
Examples: https://www.highcharts.com/maps/demo

Highmaps library is the younger sister of Highcharts and Highstock, popular charting libraries developed by Norway’s Highsoft. Its core advantages are the open source nature with all its pros, light weight which ensures high rendering performance, and a vast set of interactive features such as drill down and others.
Among the map types supported in Highmaps are choropleth and bubble maps. It is also possible to draw lines to depict a road, a river, or a connector. However, making flow maps is not as simple as with amMap or AnyMap, for example. It is also worth noting that neither Highcharts nor Highmaps can work without jQuery, so you must have this dependency if you want to use them or choose another charting library.
A good thing is that Highmaps offer multiple ready-to-use maps in both SVG and GeoJSON. The documentation is quite extensive and is great at helping you understand the library’s settings quite quickly and easily.
Cesium
Web-site: https://cesiumjs.org/
GitHub stars: 5.8k, https://github.com/AnalyticalGraphicsInc/cesium
Pricing: Free
Map Data Source: Cesium
Dependencies: None
License: Apache License 2.0
Category: Library
Examples: https://cesiumjs.org/demos/

Cesium, a WebGL-powered JavaScript mapping library, offers just that by being provider-agnostic. It has support for 3 different views: 3D globe, 2D map, and 2.5D Columbus View. It works across different platforms and different browsers: you don’t have to worry about compatibility.
Polymaps
Web-site: http://polymaps.org/
GitHub stars: 1.6k, https://github.com/simplegeo/polymaps
Pricing: Free
Map Data Source: OSM, Bing
Dependencies: None
License: SimpleGeo and Stamen copyright
Category: Library
Examples: http://polymaps.org/ex/

Polymaps is a free JavaScript library for creating dynamic and interactive maps. Besides the usual cartography from OpenStreetMap, CloudMade, Bing, etc., it works with image-based and vector-tiled maps by providing a quick display of multi-zoom datasets over maps and supports a variety of visual presentations.
Its main strength is making it very easy to composite raster and vector data from many different sources. It can meet all your requirements, particularly in letting you easily add your own coloring, grouping and interaction. Polymaps is also quite efficient: it runs quickly, it manages background tile loading well, and it’s only 30k of Javascript.
The nice thing about using SVG (scalable vector graphics) for creating maps is that it means that many of the same styling options which can be applied to web documents with CSS will also work with your map design.
As Polymaps can load data at a full range of scales, it’s a good fit for showing information from a country level on down to states, cities, neighborhoods and individual streets.
Mapael
Web-site: https://www.vincentbroute.fr/mapael/
GitHub stars: 1k, https://github.com/neveldo/jQuery-Mapael
Pricing: Free
Map Data Source: Raphael.js
Dependencies: jQuery
License: MIT License
Category: Library
Examples: https://www.vincentbroute.fr/mapael/

jQuery Mapael allows you to create maps with elegant data visualization as well as interactivity. You can, for example, create a map and designate each region on the map with different colors based on region. You can also add tooltip on the region, as well as event handlers like click or hover.
The map is built with SEO in mind by providing alternate content for search engine robots that are not capable of crawling JavaScript-generated content.
Mapael offers a collection of maps on its own repository. Documentation and API descriptions are combined in one article, but despite this you can easily get started with this library just by reading this detailed tutorial.
Conclusion
According to Google Trends 3, the most popular tools for working with Maps are Leaflet, Google Maps API and Mapbox. You can see the big gap on search queries with Bing Maps API and Openlayers, these also being quite popular.

All the free libraries we mentioned do a good job of building interactive maps. All the APIs are capable of producing great online mapping systems, but your choice should also fit in with you or your company’s future development needs.
For example, using any commercial API leaves you at the mercy of whatever changes the provider will make to the API or Terms of Service. On the other hand, using an open-source engine and the ability to switch providers anytime offers more freedom + flexibility, but it takes a lot of effort to build such systems.
We believe in using the right tool for the job. Leaflet or the Google Maps API will work well for most use cases, but there are situations that call for other tools.
For non-GIS background developers creating single-function mapping apps we will recommend Leaflet (now supported by MapBox). It’s small and easy to use. More functionality relies on plugins of varying quality and support.
Lastly, if your maps are more design and user interaction oriented, you might want to consider using D3, a JavaScript animation library that can also do some types of mapping.
Thanks for reading this, and I do hope you find the article helpful.
You might also like these articles:
20+ React Developer Tools to Increase Your Programming Productivity
17+ Articles of July to Learn Javascript
UI Javascript Frameworks and Libraries for Web Development
Originally published at flatlogic.com — React, Angular, Vue, Bootstrap & React Native templates and themes.
Text source: Top Javascript Maps API and Libraries

Top comments (2)
Thank you for the post that was so informative , I like leaftlet.js maps
Quite a big list you made buddy. cheers!