
Research and transformation by sorting pseudo-random sequences. Priority of Russia
Objective: To set up algorithms in C# and qbasic languages and table Excel compatible th, etc. it is possible to examine pseudo-random sequence for randomness and capable of determining sequence of a non-random or bad.
Graphical shell: Excel table compatible for researching by over 50 thousand elements of 2 types:
- Study of a sequence of numbers;
- Examination of sequence of digits 0 and 1. Investigation sequence of numbers : t b le defines binary attributes, such as less\more and even\oddness.
Excel Shell compatible graphical table uses formulas:
Number of consecutive matches is calculated by formula:
N=log(1-C)/log(1-P), where N is step or spectrum,
P is probability, C is reliability of probability.
Substituting C and P: N=log(1-0.99)/log (1-0.5) = 6.7 = natural value 7,
that means that 7th step of distribution should include about 1% of half data, due to counting repetitions and 0 and 1, in amount of 100%.
Distribution step number:
at C = P = 0.5; N = 1 = log0.5/log0.5 = log(1-1/2)/log(1-1/2) = 1
at C = 0.25; P = 0.5; N = 2 = log0.75/log0.5=log(1-1/4)/log(1-1/2) = 2, etc.
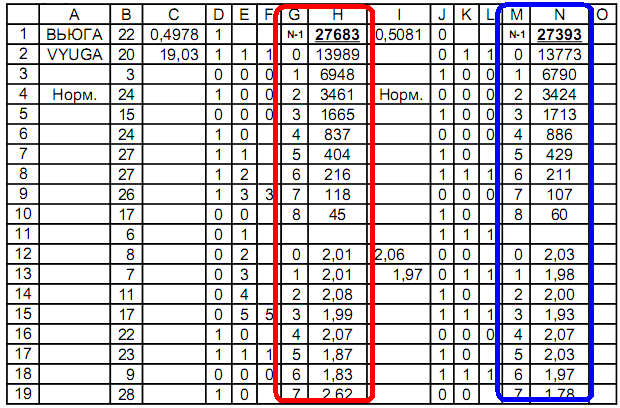
Column A is name of sequence;
Column B - sequence;
Column D - 1st distribution less / more;
Columns E, F - definition of identical ones in a row;
Columns G, H - counting number of signs identical in a row;
Column J - 2nd distribution even / odd;
Columns K, L - definition of signs identical in a row;
Columns M, N - counting number of signs identical in a row.
Formulas used in table:
Cell Formula Explanation
C1 = AVERAGE(D1: D55000) average value of sequence numbers
C2 = AVERAGE(B1: B55000) Distribution Average 1
D1 = IF(B1<C$2; 0; 1) If number is less than its unit, then 0, otherwise 1
D2 = IF(B2<C$2; 0; 1) If number is less cf. ., then 0, otherwise 1, etc.
E2 = IF(D2=D1; E1+1; 0) If signs of distribution are same, then counter of same in a row is +1, otherwise counter is reset to zero
F2 = IF(E3=0; E2; "") If counter is reset to zero g n, largest fixed counter
G2-G19 0 ... 7 Numbers in order to compare
H1 = SUM(H2:H10) Sum of comparisons
H2 = COUNTIF(F$1: F$55000; G2) Number of signs 1 in a row
H3 = COUNTIF(F$1: F$55000; G3) Number of signs 2 in a row, etc.
H12 = H2/H3 ratio of amounts of nearest straight iznako in
I12 = AVERAGE(H12:H19) average value of relationship
I13 = AVERAGE(N12:N19) average value of relationships, etc.
I1 = AVERAGE(J1:J55000) Distribution Average 2
J1 = IF(B1/2 = WHOLE(B1/2); 0; 1) If number is even, then 0, otherwise 1
J2 = IF(B2/2 = WHOLE(B2/2); 0; 1) If number is even, then 0, otherwise 1, etc.
K2 = IF(J2=J1; K1+1; 0) If signs of distribution are same, then counter of same in a row is +1, otherwise counter is reset to zero
L2 = IF(K3=0; K2; "") If counter is reset to zero g n, largest fixed counter
M2-M19 0 ... 7 Numbers in order to compare
N1 = SUM(N2: N10) Sum of comparisons
N2 = COUNTIF(L$1: L$ 55000; M2) Number of signs 1 in a row
N3 = COUNTIF(L$1: L$ 55000; M3) Number of signs 2 in a row, etc.
N12 = H2/H3 ratio of nearest number of signs
Other monitoring functions can be programmed in table.
In table it is possible to create graphs of values of any cells.
Continuation of table explores random permutation sequence
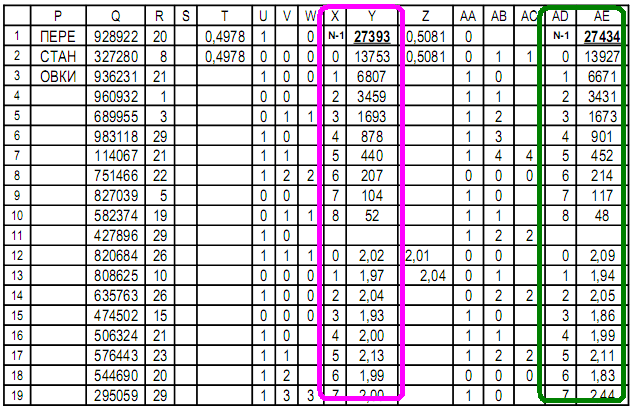
Column Q - random for permutation : integers up to 10^6,
to minimize repeat random ;
Column R - initially copy column B and then edited enenny ;
Columns T ... AE - same as columns of C of N ... .
Cell Formula Explanation
Q1 = CASEBETWEEN(0; 1000000) Random to rearrange
Q2 = CASEBETWEEN(0; 1000000) Random for permutation, etc.
Permutation is performed by sorting 2 columns Q and R:
column Q is master and column R is slave.
Result: permutations of column R and a new sequence.
RNG - random number generator: natural or pseudo.
Research on built-in RNG shows normality of algorithm.
Before reshuffling 500 cells:

After reshuffling 500 cells:

Check shows a good distribution by comparing attributes: small/large and even/odd.
Table explores trigonometric RNG using digits after decimal point of trigonometric functions, standard RNG not using.
    'rndsin.bas
    OPEN "rndsin.txt" FOR OUTPUT AS #1
    c = 0: a = SIN(TIMER) * 100 + 200
    PRINT #1, "a= ", a

    FOR k = 1 TO 10 ^ 3 + a * 10 ^ 3: NEXT

    FOR i = 1 TO 100
        FOR j = 1 TO a
            x = SIN(TIMER) * 1000 + 2000
            b = COS(x): c = c + b
            LOCATE 1, 1: PRINT j
        NEXT

        d = (ABS(c)) - INT(ABS(c))
        PRINT #1, d
        FOR k = 1 TO 10000 + a * b * c * 10 ^ 2: NEXT
    NEXT
Before reshuffling 500 cells: unsatisfactory

Obviously, distribution is poor, detecting frequency and spread of values, comparing signs: small/large and even/odd.
After reshuffling 500 cells: normal

Goal: eliminate built-in RNG.
Permutation method: original sequence is sorted, and same sequence is accepted as random for permutation, inverted or inverted in any way.
For example, in Excel, 2 copies of sequence columns are created at a distance, and one column has a leading row 1...55000 rows and 2 columns are sorted from maximum to minimum, inverting original data.
Next, 2 columns of sequence are mapped side by side and sorted, where master column is reverse and slave column is initial.
Before reshuffling 500 cells: unsatisfactory

After 500 permutations of cells: normal

Result: sequence became normal without built-in RNG.
Conclusions: true randomness is unnatural for people and it is possible to synthesize sequences that are low-power or fake, which are taken by people and computers as random sequences.
Any sequences can be synthesized in programming languages and in Excel-compatible tables.
Problem of overcoming randomness is solved by recognizing normal or false randomness in an Excel table with graphs.
Which was exactly what I needed to prove.


Top comments (5)
quantum random observe principles of binomial distribution
Previous theme:

PI and randomness of digits after decimal point. Priority of Russia
dev.to/andreydanilin/pi-and-random...
Next theme:

Falsification of randomness and transformation by sorting of pseudo-random sequences. Priority of Russia
Next theme:


Russian Sorting Halves. Priority of Russia
1000 programs
rosettacode.org/wiki/Category:C_sharp
rosettacode.org/wiki/Category:Pure...
rosettacode.org/wiki/Category:Python
rosettacode.org/wiki/Category:QB64
rosettacode.org/wiki/Category:QBasic
thousands of programs