
Application monitoring alone is not always enough to get the full picture of your systems. Frequently, services running in satellite apps (or supporting apps) can have an acute impact on your day-to-day operations. Database servers are well-known examples of this. Backup scripts and other background jobs can also slow systems and are often overlooked.
AppSignal does not watch these satellite processes by default. To extend monitoring everywhere and have all your data in a single app, you can install AppSignal’s standalone agent.
AppSignal's Standalone Agent
The standalone agent is based on the same software with which we usually instrument Ruby, Elixir, or JavaScript applications. This software can also run in standalone mode.
The standalone agent can be used to monitor:
- Infrastructure: machines that are part of our system but do not run application code.
- Background jobs: such as intensive cron jobs or long-running data-processing scripts. If these background jobs are written in a supported language (Ruby, Elixir, or Node.js) you can use the standard integration.
- More languages: programs written in languages other than those supported out of the box.
For instance, with the standalone agent, we could track a machine learning model written in Python, instrument backup scripts, monitor Kafka brokers, or collect host metrics in our web farms. You can view all this information on AppSignal to complement the metrics you already have for your main applications.
How It Works
The agent is shipped as a deb or rpm package and doesn’t have any language dependencies. It runs in any Debian/Ubuntu or Red Hat-based systems. For detailed installation instructions, check the agent documentation.
Once installed, the agent is configured in a few minutes and keeps running forever as a daemon, silently monitoring your infrastructure. What is more, the agent includes a StatsD server that relays any custom data you log into your AppSignal dashboard.
What Is StatsD?
StatsD is a standard for collecting and aggregating arbitrary data. It focuses on logging metric and performance information. It uses a lightweight text protocol over UDP connections that have a small footprint in your machine.
A StatsD message looks like this:
KEY:VALUE|TYPE
Where KEY is any arbitrary string, and VALUE is a number. The type value defines how the number is processed.
We support three types of metrics:
-
c: this is a counter that increments each time it is called. For instance,
active_users:1|cadds 1 to theactive_userscounter. - g: a gauge takes a numeric value and maintains it until updated. This is useful to record values that change up and down over time, such as throughput, number of active users, or number of pending tasks in a queue.
- t: stores timing values. This type is ideal for tracking durations. AppSignal calculates means, count, and percentiles for all the logged timings.
Other unsupported metric types will be silently ignored.
Sending Data to StatsD
The standalone agent listens for UDP packets on port 8125. We can send StatsD-formatted strings from the command line using netcat:
echo -n "myscript.myevent.counter:1|c" | nc -4u -w0 localhost 8125
Since we’re using UDP, we don’t have to wait for a response.
Socat also works:
echo -n "myscript.myevent.counter:1|c" | socat - udp:localhost:8125
This makes it easy to instrument any batch or cron jobs. For instance, the following lines use a gauge to log how much data a backup job has generated:
backup_size=$(du -m /backups | cut -f1)
echo -n "backup.data:$backup_size|g" | nc -4u -w0 localhost 8125
We’re not limited to integers. StatsD also works with floating-point numbers:
echo -n "network.latency:0.2|g" | nc -4u -w0 localhost 8125
Using Tags
You can add tags to your metrics. The StatsD server supports optional tags at the end of the message:
KEY:VALUE|TYPE|#TAGS
We can apply several tags in the same message and assign values for filtering later:
echo -n "backup.data:$backup_size|g|#backups,env:production" | nc -4u -w0 localhost 8125
We’ll learn how to see the data in AppSignal in a bit.
Instrumenting Languages
The StatsD server is compatible with any language that can send UDP packets. Let’s see a few examples.
Python is a popular language for data mining and machine learning. We can add instrumentation into Python applications using the build-in socket library:
import time

# measure time taken for function
start = time.process_time()
train_my_model()
training_time = time.process_time() - start

# send value to statsd
import socket

UDP_IP = "127.0.0.1"
UDP_PORT = 8125
MESSAGE = b"model.training.time:" + bytes(str(training_time), 'utf-8') + b"|t"

sock = socket.socket(socket.AF_INET, socket.SOCK_DGRAM)
sock.sendto(MESSAGE, (UDP_IP, UDP_PORT))
We could achieve similar results in Java with the java.net library:
byte[] buffer = "mybatch.exception.counter:1|c".getBytes();
InetAddress address = InetAddress.getByName("127.0.0.1");
DatagramPacket packet = new DatagramPacket(
    buffer, buffer.length, address, 8125
);
DatagramSocket datagramSocket = new DatagramSocket();
datagramSocket.send(packet);
PHP is another of the incredibly popular language. We can send UDP packets with socket_sendto:
$msg = "mywebsite.active_users:$ACTIVE_USERS|g";
$len = strlen($msg);

$sock = socket_create(AF_INET, SOCK_DGRAM, SOL_UDP);
socket_sendto($sock, $msg, $len, 0, '127.0.0.1', 8125);
socket_close($sock);
StatsD Clients
Thus far, we used the built-in networking capabilities in every language. But there’s more. Many languages and products include third-party StatsD clients or addons. Any StatsD-compliant client should work, at least for the supported data types. You can find a list of clients at the StatsD project wiki.
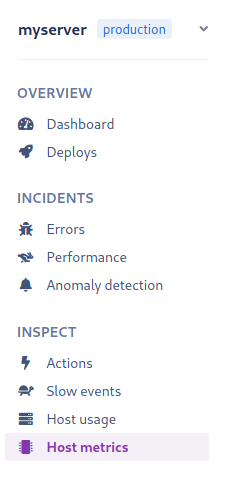
Viewing Host Data in AppSignal
The Host Metrics dashboard shows your machine’s resource utilization:
AppSignal adds an entry for every machine running the standalone agent.
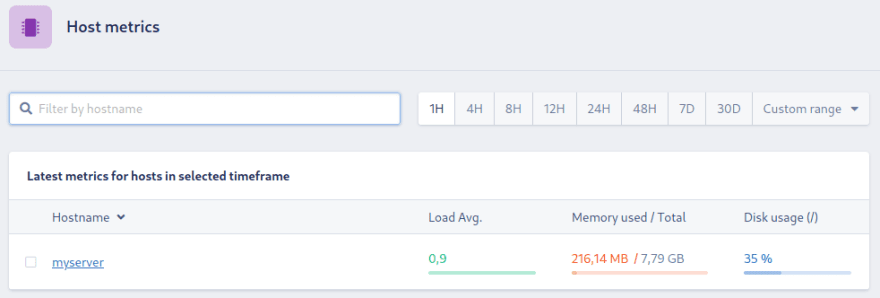
The dashboard shows the load and CPU averages disk, network, memory, and swap usage:


Creating Dashboards
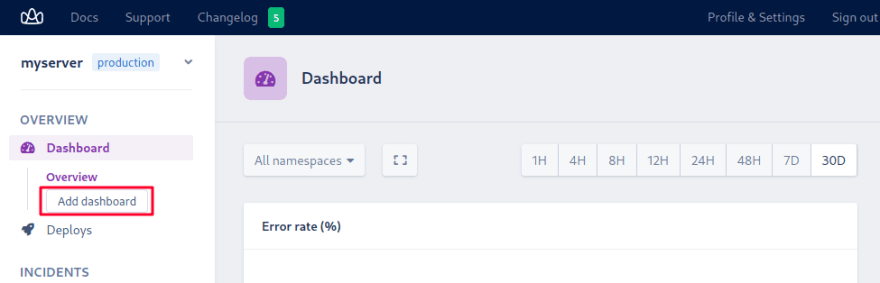
AppSignal doesn’t automatically generate dashboards for the StatsD value you sent—you’ll need to create custom dashboards for this.
First, click on Add dashboard under the dashboard menu:
Give a name to the dashboard:

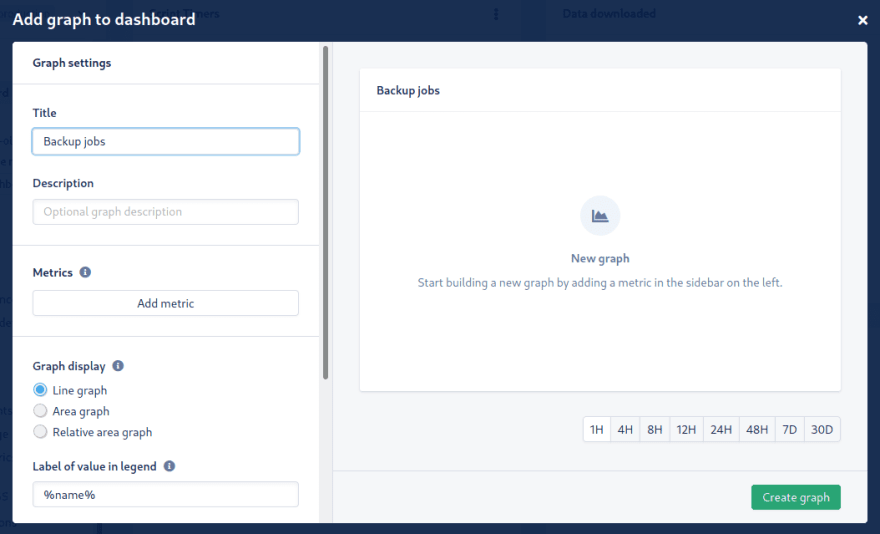
Clicking the Add graph button shows the graph builder:

Give a name to the graph, and click on Add metric:
Pick the metric you’re interested in from the menu.
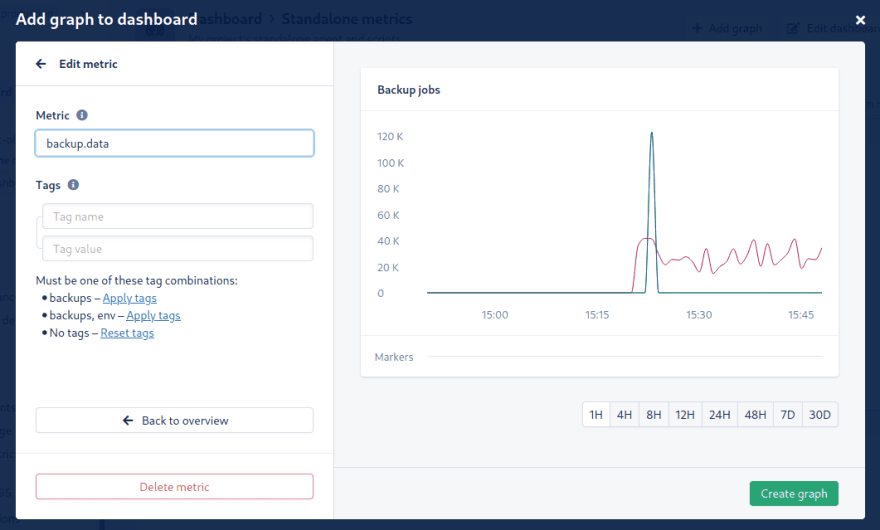
Optionally, use tags for filtering:

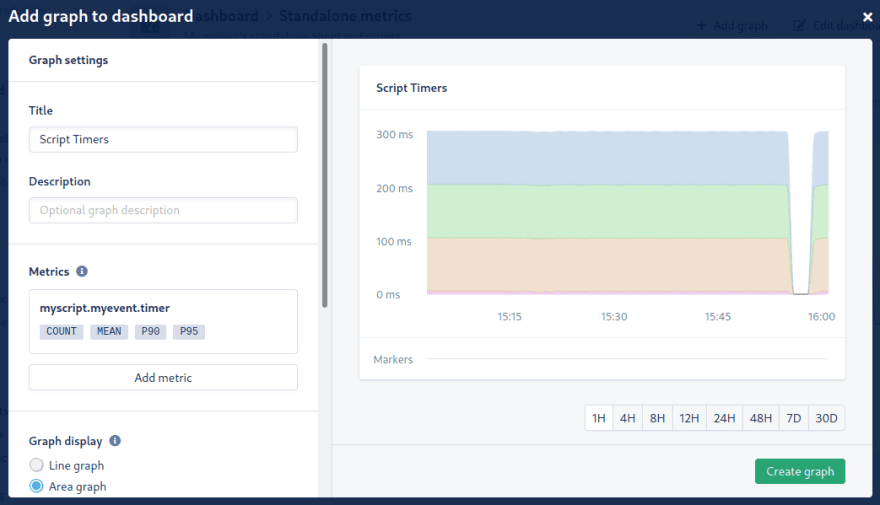
Next, click Back to overview. You might want to try different graph types and value units to find out which one best suits the data you want to represent.
Timing data looks better with area graphs because the mean and percentiles are shown more clearly.
Line graphs work great for counters and gauges.
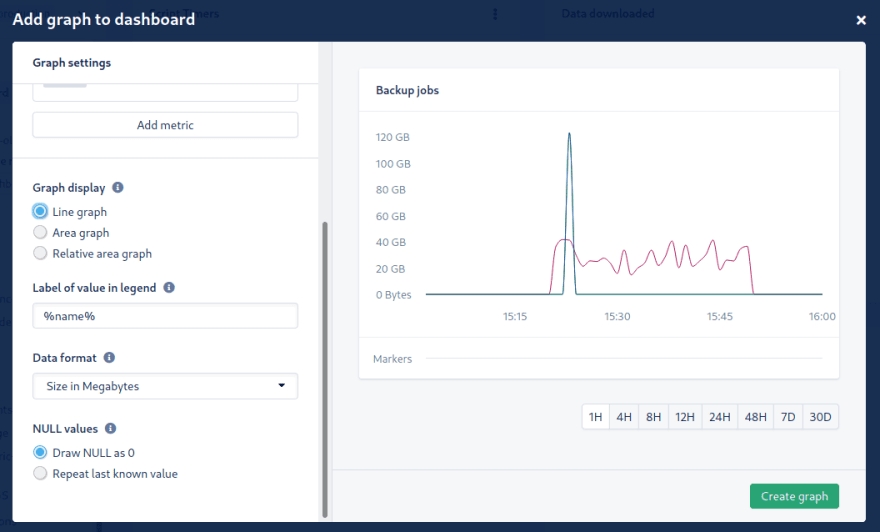
Once you’re happy with the result, click on Create graph.

Wrapping Up
We’ve learned how to use AppSignal’s standalone server to watch your machines and satellite code. With its built-in StatsD server, you can record arbitrary performance data and instrument any process.
Check the following links to learn more about using the standalone agent:
- StatsD reference.
- How to send custom metrics.
- Creating dashboards in AppSignal.
- Identifying and Resolving a Kafka Issue the Standalone Agent.
Our guest author Tomas spent 10 years working at IBM, where he did a bit of everything: development, service delivery, database administration, and cloud engineering. He's now an independent consultant and a technical writer.

Top comments (0)