
Recently, I have been wanting to up my game when it comes to analysing data — so I decided to use this as an opportunity to take AWS Athena for a whirl and see what it’s capable of.
Throughout this blog I am going to try and understand Athena and the features it has while working with a chocolate dataset.
So what is Athena? 🤔

AWS Athena is an interactive query service that analyses data using standard SQL. Athena is able to work with both structured and unstructured data and can work directly with data stored in s3!
What we’ll be using 👩💻
In this blog we are going to be integrating with a number of different AWS services including:
- S3
- IAM
- Glue
- Athena
We are going to be storing our data in an S3 bucket and then using a Glue crawler to create the table schema required by Athena — don’t worry if this sounds a bit scary now, we will be going through and explaining this step by step.
Show me the data 🍫
I am going to be using a chocolate dataset from Kaggle, which is a CSV file containing over 1700 ratings for chocolate bars and includes information regarding the type of bean being used, the regional origin and the percentage of cocoa they contain. The rating is a score between 1–5 (5 being great and 1 being unpleasant.)
Storing the data 🗄
Before we dive straight into working with Athena we need to put our data in AWS Simple Storage Service (S3).
You will need to create a bucket within s3 that has two folders inside it, one for the chocolate dataset and one for the results of the queries.
If you have not worked with S3 before, check out my previous post that will guide you though creating your bucket, uploading data and creating folders!
Athena Time ⏰
So in this tutorial we want to use Athena to run the following queries against our data:
- Get all the countries listed in the dataset
- Sort countries by rating
- Discover the relationship between cocoa solids percentage and rating
Lets dive straight in 🏊♂️
In the AWS console we will navigate to Athena:

Once Athena opens we can go ahead and click on get started:

Connecting the Data 🧩
First thing we will need to do is connect to the data that we have stored in S3. In Athena you will see at the top left hand side of the screen there is an option to Connect Data Source, we will want to select this.

Once selected, you will see this:

This will allow us to choose our data source and connection method. We will choose S3 for our datasource as this is where our data lives and for the metatdata catalog we will go for the default which is AWS Glue.
What is Glue I hear you asking? 🤔
AWS Glue is a fully managed extract, transform, and load (ETL) service that makes it easy for customers to prepare and load their data for analytics
In Athena, tables are formed from the metadata definitions of the data’s schema. However, since S3 is just the data, we need to use a Glue Data Catalog to store this metadata about what lives within our selected S3 location (e.g. location, structure, column names, data types etc.) It is this metadata that will allow Athena to query our dataset!
One thing you might be thinking at this point is, how are we going to get this metadata to store in our Glue Data Catalog? Well, this is were Glue Crawlers come into play!
We can use a Glue Crawler to automatically extract our metadata, and create our table definitions!
In the previous step when we choose our data source and connection method, this screen is then displayed and it is here where we want to select to set up our Glue Crawler:

When we go ahead and click connect AWS Glue, it will open up the Glue console for us:

Here we select Get Started then select Add table using a Crawler :

This prompts us to give our crawler a name:

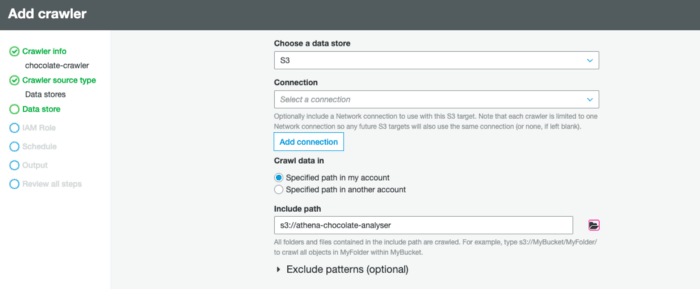
With our crawler named, we now also need to select Data Stores as our crawler source type:

Now we need to actually point it to our S3 bucket, typically a connection is not required for Amazon Simple Storage(S3) sources/targets, so we can leave this part blank:
Creating an IAM role
An IAM role is an Identity and Access Management entity that defines a set of permissions for making AWS service requests.
Our next step involves creating an IAM role to allow the crawler to have permission to access the data that we have put in S3.

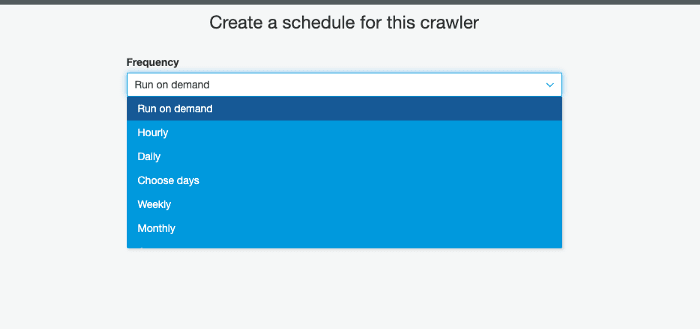
When working with data that is constantly changing, you might have it set up that new data is being added to S3 hourly, daily or monthly — for this you can schedule the crawler to make sure it is always working with your most up to date data, by creating Crawler schedules expressed in cron format. However for this tutorial we are just going to select the Run on Demand setting as we only have the one dataset and we want to trigger it:
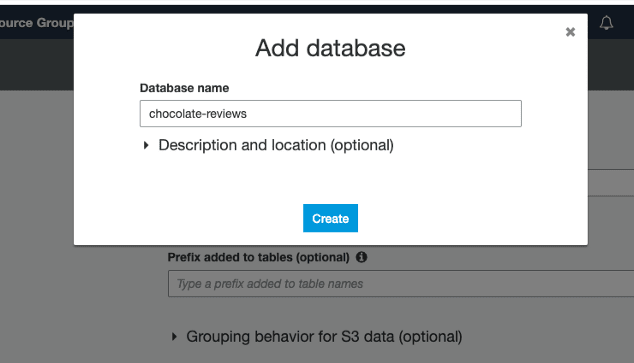
Now we have nearly got our crawler set up, we just need to add a database for the data to be store in:
Once the database has been created, you are presented with an overall summary, if everything looks good — click Finish

With our crawler set up, we can go ahead and kick it off, by selecting Run Now and we will then be notified once the crawler has ran:
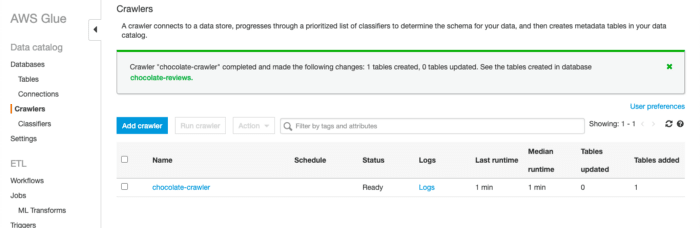
The crawler has now went through our data, and inspected portions of it to determine the schema. Once we click into view it, we can see that it has been able to pick out each of the columns names and the data type for each column:

Now if we flip back to Athena, we can see that our database and table have now been populated with what we have just created:

One last thing we will need to set up before we query our data, is the results location — to do this, you can click on the link at the top of the page in the blue notification box:

Athena needs to know where the results from each query should be stored. For this we want to direct it to the results folder we created in S3:

Let the fun begin 🎬
Now we have all our set up done, we can dive in and start querying the data!
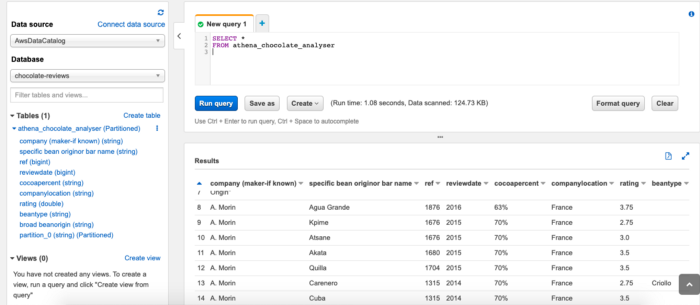
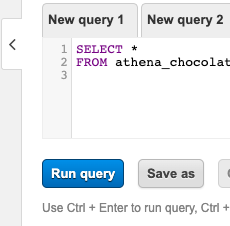
To query the data we can use standard SQL commands such as SELECT, FROM, WHERE, GROUP BY, ORDER BY, etc. I will go over some of this below, but to actually run the queries we need to enter them into the Query Panel on Athena, which is shown in the screen shot below:

To start off I am just going to try and select all the data, just to make sure everything is set up correct and to make sure we are getting data back. To do this I am going to run the following query in the query panel:
SELECT * FROM athena_chocolate_analyser;
~~~~~
and we can see, everything has been set up correctly and we are receiving results back:
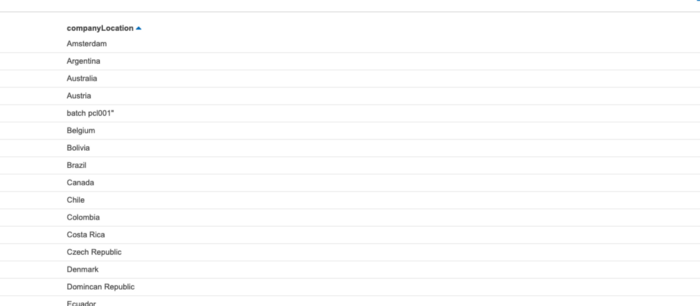
Now let’s try out some of our other queries! First up, getting a list of all the countries contained in the dataset:
~~~~
SELECT DISTINCT companyLocation
FROM athena_chocolate_analyser;
~~~~
Here we have also used the `DISTINCT` statement, to make sure that we aren’t getting back duplicates! This gives us back the following list:
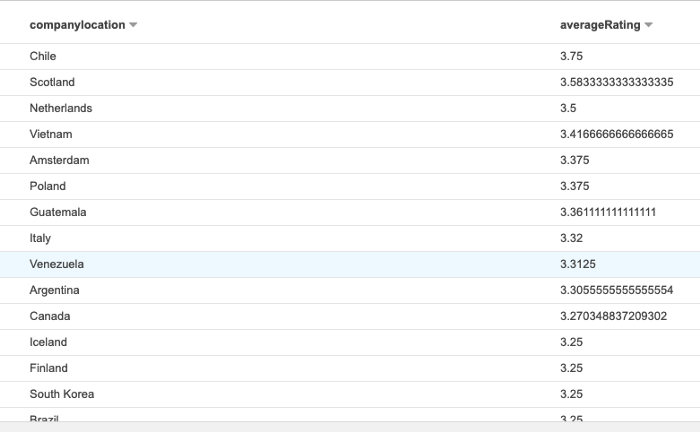
Next we want to sort countries by their ratings to see which ones produce the highest rated bars, for this I used the following query:
~~~~
SELECT companylocation,
AVG(rating) AS averageRating
FROM athena_chocolate_analyser
WHERE
companylocation IS NOT NULL AND rating IS NOT NULL
GROUP BY companylocation
ORDER BY averageRating DESC
~~~~
Here I have thrown in a couple more SQL statements for example `AVG` to find the average rating, `AS` to create a alias temporary name for a column, `NOT NULL` to make sure we aren’t getting any null or empty values back and then also the `GROUP BY` and `ORDER BY` statements to group and sort the data returned!
Which then brings back a list sorted by the average rating for that country, so we can see that the highest rated chocolate comes from Chile!
Our final query, is to try and see the relationship between the percentage of cocoa and the average rating. To do this I used the following query to find the average rating and the cocoa percentage and to group the results by the cocoa percentage:
~~~~
SELECT cocoapercent,
AVG(rating) AS averageRating
FROM athena_chocolate_analyser
WHERE
cocoapercent IS NOT NULL AND rating IS NOT NULL
GROUP BY cocoapercent
ORDER BY averageRating DESC
~~~~
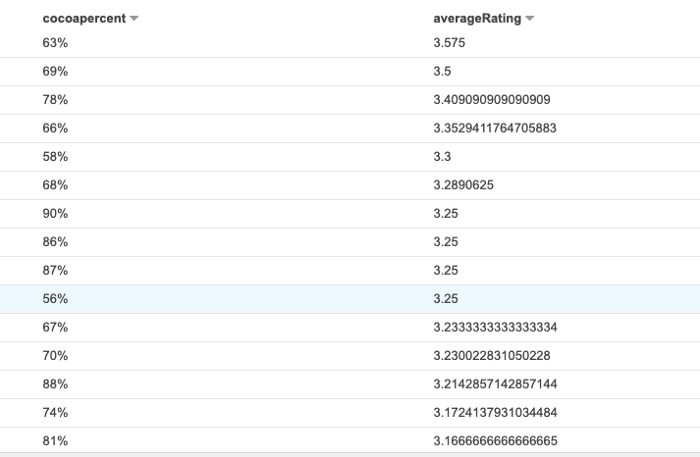
I find this all really impressive, as it’s super easy and fast to query the data to get these results!
You can view the history of the query’s ran against the data here in the history tab, which is useful to look back on:
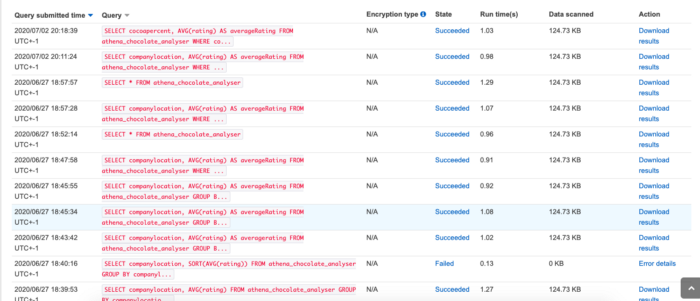
And if you want to save any of your query results, you can click the `Save As` button at the bottom of the query panel and this will save your results into the results folder you have set up in s3 — you will notice in the screen shot about that each query has a unique identifier called a `Query ID`. This makes it easier work with/find query result files.
##Conclusion
I have really enjoyed my first attempt working with Athena, it seems super fast and powerful. With its ability to query data sitting in S3 and export results, I can already see so many real world use cases for example; querying billing/usage reports, to gather insights on spending.
I plan on taking a more detailed look into it, now that I have scratched the surface, so watch this space for more blogs to come!

Top comments (1)
This was an excellent write-up.