
in our previous article, we talked about visibility over code and visibility over data
now in this article, we will talk about visibility over the model training process and all the experiments undergoing
the main point in this stage is to be able to:-
debug and get full insight over the training process.
reproduce the experiment at any time points by 360 degree tracking of model and all what around it
now let's start by first point training visibility and experiment tracking within AWS and that can be done via Amazon SageMaker Debugger.
Amazon SageMaker Debugger
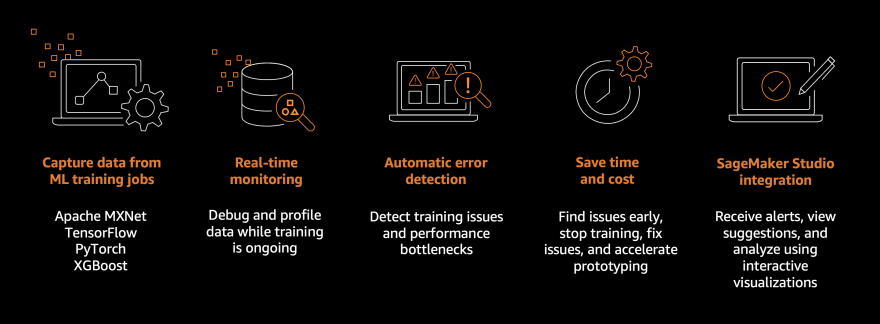
it is a great tool that can help us to monitor, debug, monitor, and profile training jobs in real-time, and with integration, with other AWS services, it can be a very powerful tool as if you have a training job run in a cluster we can check the resource utilization for reducing cost end notifications to take actions if something happens.
The data captured by aws sagemaker debugger are : framework metrics (operations between steps and gradient descent algorithm operations to calculate and update the loss function ) , system metrics (hardware resource utilization such as CPU, GPU, and memory utilization), output tensors ( model parameters that are continuously updated during the training such as weights, gradients, input layers and output layers )
lets see how to add-hook profiler in the training phase
first we start by define where to store report data and what is the rule we want to profile and look for
import boto3
import sagemaker
from sagemaker.pytorch import PyTorch
from sagemaker.debugger import Rule, ProfilerRule, rule_configs , DebuggerHookConfig , ProfilerConfig, FrameworkProfile

sess = boto3.session.Session()
region = sess.region_name
bucket = sess.default_bucket()
role = sagemaker.get_execution_role()

#set rules we want to montoir
rules = [
    Rule.sagemaker(rule_configs.loss_not_decreasing()),
    ProfilerRule.sagemaker(rule_configs.LowGPUUtilization()),
    ProfilerRule.sagemaker(rule_configs.ProfilerReport()),
]

#capture   profiling information from step 5 to step 15.

profiler_config = ProfilerConfig(
    system_monitor_interval_millis=500,
    framework_profile_params=FrameworkProfile(local_path="/opt/ml/output/profilerme/", start_step=2, num_steps=20)
)

metric_definitions = [
     {'Name': 'validation:loss', 'Regex': 'val_loss: ([0-9.]+)'},
     {'Name': 'validation:accuracy', 'Regex': 'val_acc: ([0-9.]+)'},
]

# define place for dubging report output
debug_hook_CFG = DebuggerHookConfig(
    s3_output_path='s3://{}'.format(bucket),
)
now normally we start creating training job just we add the new profiling configrution
#ecr container image to push or code in it
image_uri = (
    f"763104351884.dkr.ecr.{region}.amazonaws.com/pytorch-training:1.6.0-gpu-py36-cu110-ubuntu18.04"
)
hyperparameters = {
    "batch_size": 64,
    "epoch": 22,

}
train_ins3 = sagemaker.inputs.TrainingInput(

    s3_data=  train_data_s3_uri,

)

val_ins3 = sagemaker.inputs.TrainingInput(

    s3_data=  val_data_s3_uri,

)

data_channels = {

    'train': train_ins3,
    'validation': val_ins3
}

#set profiler in the estmitor

estimator = PyTorch(
    role=role,
    image_uri=image_uri,
    instance_count=1,
    instance_type="ml.p3.2xlarge",
    source_dir="sorcdir",
    entry_point="pytod.py",
    hyperparameters=hyperparameters,
     metric_definitions=metric_definitions,

        debugger_hook_config=debug_hook_CFG,
    profiler_config=profiler_config,
    rules=rules,
)
we can now start training
#start training
estimator.fit(inputs=data_channels, wait=False)
# get job name
print(estimator.latest_training_job.describe()['TrainingJobName'])
#wait for training to finish
estimator.latest_training_job.wait(logs=False)
and you can go to cloudwatch to see the information we monitor is logging in realtime for you
also you can go to s3 location where we set the profiling output and get the reports by job name
and final we get results
# get the analytic report
df_metrics = estimator.training_job_analytics.dataframe()
df_metrics.query("metric_name=='validation:accuracy'").plot(x='timestamp', y='value')

Now the 2nd part we want to cover reproduce the experiment at any time points
and that need to know
- which data version used
- which features version used
- which model & code version and all around it
- which container image used and any other metadata that needed to do track all experiments steps all of the above is done by SageMaker model registry
AWS SageMaker model registry can do (models Catalog , model versions management , all metadata is captured with version for reproducibility, model deployment with management of model status and approval ,automated deployment )
we often register model based on workflow pipeline , i talked in brief video in part-1 about that area of pipelines but will talk about pipelines and workflows in details in dedicated part of the series so for now we will just see simple code of model register as if we have built the pipeline
from sagemaker.workflow.step_collections import RegisterModel

register_step = RegisterModel(
    name="RegisterTheModel",
    estimator=estimator,
    image_uri=inference_img_uri,
 model_data=training_step.properties.ModelArtifacts.S3ModelArtifacts,
    content_types=["application/jsonlines"],
    response_types=["application/jsonlines"],
    inference_instances=[deploy_inst_type],
    transform_instances=[deploy_inst_type],
    model_package_group_name=model_group_name,
    approval_status=model_approv_status,
    model_metrics=metric
)
now we done and see you next .. thanks for reading

Top comments (0)