
I've been blogging since 2019. I started off intermittently posting articles maybe once a month, as we all do. As I got more and more comfortable with writing, I started setting goals for myself. I tried to write 3 articles a month. I mostly hit it, but didn't quite reach it. However, I was bitten by the writing bug.
Before I knew it, I was determined to write 50 blog posts in a single year. It was a daunting task, but I did it. I published an article every Wednesday for an entire year. In fact, I still have that streak alive! This article marks my 75th week in a row to publish a new article on a Wednesday.
Every time I publish an article, I also cross-post it on other blogging websites. As much as I'd like, not everybody discovers my content through my personal site. My audience is dispersed across Medium, dev.to, and Hashnode in addition to my site. Whenever I'd publish an article, I would also publish it to each of these three sites.
As you can imagine, that would take a decent amount of time every week. So I automated it. I built a solution that would take my articles, transform them to the appropriate format for each platform, then publish the content on the platform via an API call, being sure to make my blog the canonical reference.
It didn't occur to me until recently that all these efforts might not be as fruitful as I originally thought. Each blogging platform has its own set of readers with their own interests. There's no consolidated place to see view count of my articles, so unless I bounce between the platforms, I don't know which type of content resonates where. Hint - I do not regularly look at view counts anywhere.
Getting this kind of information would allow me tailor my content appropriately and help me decide if it's still worth supporting a specific platform. On top of that, I also want to see if my blog posts are a "flash in the pan", meaning they get some buzz then die forever.
So I built it. Let's take a look.
Features
Given the requirements I mentioned above, I wanted an automation that performed several tasks:
- Gather total views for all my articles across all blogging platforms
- Calculate the number of views week over week for each article for each blogging platform
- Identify the top 5 most viewed articles for the week on each platform and overall
- Save weekly results for monthly and yearly trend analysis
- Send me an email with the results
- Do this all automatically without any manual triggers
Sounds like quite the feat! At the time of writing, I have published 145 blog posts (including this one). Insights like this will allow me to make decisions on how to proceed and open up the door to future AI-recommendations.
Overview
As with most of the automations I build, this project was built using AWS Step Functions. There are many tasks that must occur in a specific order, so using an orchestration service makes the most sense. Let's take a look at the workflow.

As you can see in the diagram, the workflow performs the following tasks:
- Load all articles from the database
- For each one:
- Fetch the total view count from Medium, dev.to, Hashnode, and Google Analytics
- Fetch last week's view count record from the database
- If the record exists, subtract the new total view count from last week's total view count for each platform
- If the record does not exist, it uses the total count as the week's total (because it's a new article)
- Saves the weekly and total counts to a new record in DynamoDB
- Waits 10 seconds (to prevent throttling errors in the blogging platform APIs)
- Discards the iteration context (to prevent maximum state transition size errors)
- Get the most viewed articles from each platform and generate email html
- Send me an email with the results
As far as workflows go, not too bad. But let me tell you, it was a labor of love to get there. Pretty much everything that could go wrong, went wrong.
The Plethora of Problems
This was probably the most challenging build I've had in a while. Thinking about it from a high level, this sounds like an easy problem to solve. Just hit a few APIs, do some math, and send an email, right? What could possibly go wrong?
Problem 1: Getting View Counts
When you think of article metadata, what's one of the first things that comes to your mind? It's total view count, right?
Apparently not to Medium, dev.to, or Hashnode.
There is no direct API call that gives you view count for a specific post for any of them. I could get at the data in a roundabout way, but of course it was wildly different for each platform.
Medium: Their API is limited to POSTs. You can only create a new article with it. So naturally I went to the user interface to see how data is loaded there. Turns out there's an undocumented internal GraphQL API that fetches data. It doesn't use the API token the REST API uses, but rather it uses a cookie for auth. I intercepted the cookie, put the request into Postman, and tried it out. It worked! Turns out the cookie saved in a browser session doesn't expire, so I threw it into Secrets Manager and use it in my Lambda function to authenticate my requests.
Dev.to: Again, no documented API that gets you the total view count. Instead, they provide an API that gets you the view count broken down by day. If you want the total number of views, you have to go from the beginning of time (which in the case of their API is April 1, 2019) and add the results up programmatically. Yes, this is what their user interface does! The hardest part about this was getting the "article id" the API requires. I hadn't been tracking the id of my posts, so I had to find them all. I ended up building a screen scraper that correlates the article id to the post slug and used that mapping to get the data. I then had to write a script to update ALL my previous article DDB records with the ids for all the platforms.
Hashnode: There's not many good things to say about the Hashnode API. It has two documented GraphQL operations and that's it. Neither of which return view count for a post. So I took to the UI again, intercepted the calls made on their analytics page and made a plan. Their analytics API returns a paged result set with total view counts and post slugs. So for this, I had to load the posts across all the pages, then search the set for specific posts to get the view count.
Google Analytics: By far the best API - once you figure it out. I felt like I got deep into the bowels of GCP setting up trust relationships between Google Analytics and my API key. There's no way I could do it again. This one was also tricky because the analytics npm package requires a local credentials file for initialization. For obvious reasons, I did not want to check that credential file into source control, so I saved the encoded contents in AWS Secrets Manager. When my Lambda function that fetches the data runs, it decodes the value in the secret, saves it to a local file in the tmp directory, then uses that to initialize the client.
Problem 2: Throttling
Step Functions gives you a maximum concurrency of 40 when you use a Map state (and significantly more if you use distributed map). I started off gung ho and ran all 40 concurrently to load stats for my articles as quickly as possible.
It took about 2 seconds for my hacky way of loading data to receive its first 429 - Too Many Requests status code. So I had to bump down the concurrent executions. Through trial and error, I ended up with a concurrency of 1 and still had problems.
This is when I introduced the wait state into the mix. I was processing one article at a time and slept the state machine for 10 seconds at the end of each one. This slowed down processing enough to not get rate limited by the internal APIs I was using.
And of course, the 10-second wait wasn't good enough. In the event that I did get a 429, the workflow fell apart. So I took advantage of the robust error handling and retry capabilities of Step Functions to handle these errors specifically.
 {
  "ErrorEquals": [
    "RateLimitExceeded"
  ],
  "BackoffRate": 2,
  "IntervalSeconds": 30,
  "MaxAttempts": 6
}
Once the backoff and retry was implemented, I was good to go. I haven't had issues with rate limits breaking the workflow execution.
Luckily this is a background process and was already set up as a standard workflow instead of express. So the extended time it took to retrieve the data was not a problem.
Problem 3: Max State Transition Size
Everything worked great processing the articles one at a time until the Map state completed in the workflow. On complete, all the data from the iterations is compiled together in an array and sent to the next state.
The problem here is that I have 145 articles, with that number growing every week. So aggregating the data from 145 iterations of a map state very quickly exceeded the max limit of 256KB.
To resolve this problem I did two things: clear out the execution context at the end of each iteration and throw the map results away before transitioning to the next state.
I probably only needed one of these to work properly, but none of the data was needed, so throwing it away was a non-issue.
How It Works
There is a lot of data flying around in this workflow. I need to aggregate and sort view counts based on blogging platform, and it needs to work across Lambda execution environments. Luckily for me, I have an "in" at Momento and know that a sorted set does exactly what I need.
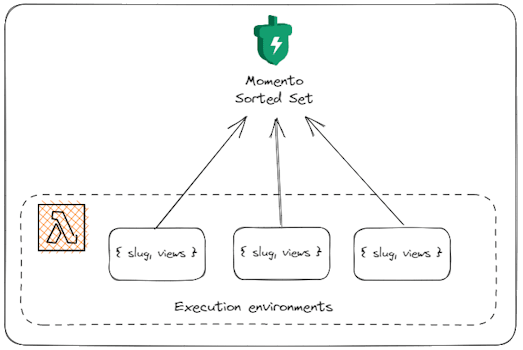
Storing data remotely in a centralized cache allows me to have as many execution environments as I need to process the data and not worry about losing any data. A sorted set will automatically sort the posts by number of views, so getting back the top 5 most viewed articles is as simple as a single API call. I don't have to build any sorting logic, I just say I want the top 5 values in descending order.
Since these items are cached, they are deleted automatically when the time to live expires, so I don't have to worry about cleaning up data between my weekly executions.
const getTopResults = async (cacheClient, top, sortedSetName, displayName) => {
  let topArticles = [];
  const response = await cacheClient.sortedSetFetchByRank('blog', sortedSetName, {
    order: SortedSetOrder.Descending,
    startRank: 0,
    endRank: top
  });

  if (response instanceof CacheSortedSetFetch.Hit) {
    topArticles = response.valueArray().map(item => {
      return {
        slug: item.value,
        views: item.score
      }
    });
  }

  return { source: displayName, topArticles };
};
This will return the top N results, with N being the value provided in the top parameter to the function.
Once data is aggregated, sorted, and returned, I generate a table in HTML with the values for each blogging platform and publish an EventBridge event that triggers the SendEmail function from my serverless toolbox.
After a few moments, I receive an email that breaks down the overall and platform-specific views for the week.

Disclaimer - these are all-time numbers. It was the first email I received from this automation, so it couldn't send me the weekly report. Also, all my personal blog stats were reset on April 1 when I switched versions of Google Analytics.
This worked for all the existing articles that I screen-scraped ids for. But what about new articles? I don't want to continue scraping dashboards to find ids.
Luckily the id is returned in the response for all the APIs I was using to cross-post the content originally. So it was a simple manner of grabbing the id from each platform and creating a new id object on my article record that stores the unique identifiers for each platform. Now when this new state machine runs, it has access to what it needs to fetch view counts.
Making Sense of the Data
It's still early in my exploration of these stats. But seeing the data side by side in that email above makes it easy to draw some initial conclusions.
Medium and my personal site get significantly more views than dev and Hashnode. It could be the publications I'm posting to or it could simply be that what I write about isn't engaging to the audience on those platforms. That said, the conclusion I draw from this is that my time is best spent optimizing Medium and my site.
Also, it doesn't appear that my articles are a flash in the pan. There are a few that are relatively old but continue to get views over time. I will keep tabs week over week to see the content that appears to be evergreen.
An interesting thing to note as well is that the articles that get the most views on each platform are different! Of course, the article I posted that week gets the most views, but beyond that, it appears that each platform has different interests that make the posts perform better than others.
What's Next?
After I get a few weeks of data, I'll have enough to start drawing definitive conclusions.
That said, I'm not an analytics expert. I wouldn't even consider myself an analytics beginner. I know how to build software that gathers metrics but converting those to insights is not easy. So I'll build another automation that takes the data, feeds it to ChatGPT, and ask for suggestions, charts, and inferences.
This will identify the topics that do particularly well on each platform, find the cross-overs, and make recommendations to me that reflect the data. My overall goal here is to provide you with more content you like!
I hadn't considered looking at the data across all my cross-postings before. In my head, I assumed the more, the merrier. Turns out this might not be the case. There's so much more involved with content creation than I ever imagined. Knowing target audiences, remembering which sites they visit, and identifying topics that do well never crossed my radar early on. Now it's all I think about.
I like being in a constant state of improvement. I'm at the point with my writing career where that means looking at data and insights to start zooming in (or zooming out) on certain niches.
Overall though, this is fun. The code I walked through today is not open-source...yet. But if you ask me to see the code, I'll be happy to do so.
Happy coding!

Top comments (0)