
Matplotlib is the most popular plotting library for python. It was designed to have a similar feel to MatLab's graphical plotting. Since Matplotlib is an open source library, we are free to make use of it. Matplotlib is the result of development efforts by John Hunter (1968–2012) and the project's many contributors.
There are two types matplotlib:
Functional
Object Oriented
Functional Plots
Examples:
import matplotlib.pyplot as plt
import numpy as np
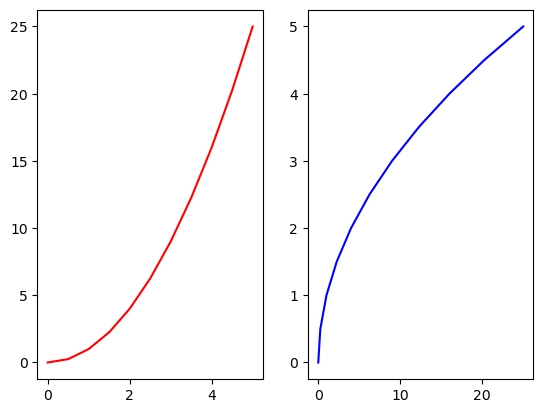
x = np.linspace(0,5,11)
y = x**2
#FUNCTIONAL
plt.subplot(1,2,1)
plt.plot(x,y,'r')
plt.subplot(1,2,2)
plt.plot(y,x,'b')
Output:
First are going to use matplolib.pyplot as plt and if you are using jupiter notebook you should also use %matplotlib inline it will allow you to see the plots you create inside the Jupiter Notebook. then you can import numpy library to create to arrays.
then you can plot a graph and if you are not using Jupiter Notebook you have to type .show() many times. Only difference with Jupiter Notebook is it automatically prints you your output. And you can do multiplots using subplot() method it takes multiple arguments (number of rows, number of columns, plot number). and r and b represents color r represents red and b represents blue.
Object Oriented
Example:
#OO
fig = plt.figure()

axes = fig.add_axes([0.1,0.1,0.8,0.8])

axes.plot(x,y)
axes.set_xlabel('X Label')
axes.set_ylabel('Y Label')
axes.set_title('Set Title')
Output:

This figure method you can think it as imaginary set of canvas and you can add set of arrays to this canvas. The add_axes() method figure module of matplotlib library is used to add an axes to the figure. And set_label() are used to label axis and naming them.
You can check out many ways on how you can plot graphs using matplotlib by clicking this link below:

Top comments (0)