
Hello,
I'm going to present you how I created a simple map with the leaflet extension.
It allowed me to display a set of bike stations in the city of Lyon in France and to display custom tracks.
What was the objective?
The objective was to have two buttons, to be able to display all the bike stations of the city of Lyon and routes from geoJson files.
So I started by writing those button in HTML :

After defining the buttons of my choice.
I needed to create a simple and JavaScript compatible map. To do this I found Leaflet.
Installing a Leaflet Map:
It was a simple task, I just followed the instruction here: https://leafletjs.com/examples/quick-start/
Configuring the map
You can discover several choices of maps that can be integrated on Leaflet here :
https://leaflet-extras.github.io/leaflet-providers/preview/ on the site, I chose the CartoDB_Positron and imported it.

Once the map is chosen, we can add some basic options, so the initial coordinates when loading the map and the zoom is the city of Lyon in France
![]()
Layers are the options to add markers on the map.
So I chose to create 2 layers, one for my bike position and one for my routes

Some jQuery
I know that jQuery is not very optimized or efficient, but I found it very suitable for the 20 lines of code I needed to detect the use of buttons on my site
In the first choice, my code only runs when a choice is validated, it will call the "roadFetch" function passing the name of the necessary API route :
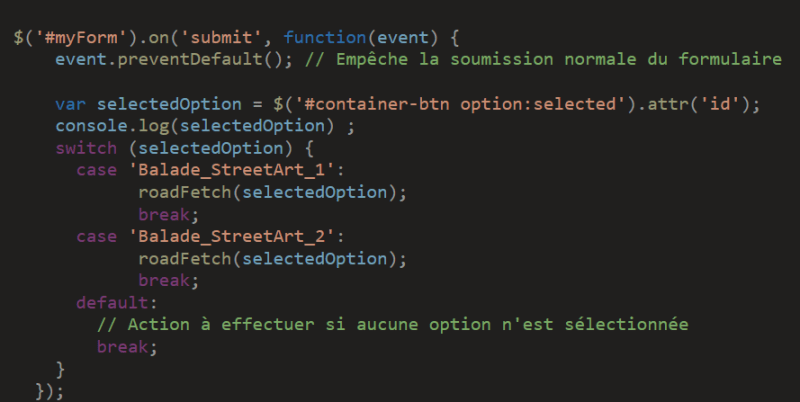
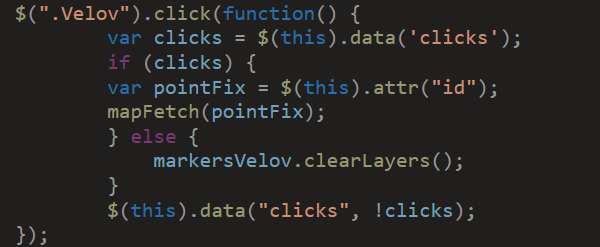
In the second option my code will only run when the user will interact with my button dedicated to bike stations, it will call the function "mapFetch" passing the name of the necessary API route:
API Calls:
In order to facilitate a delivery on a production environment, I added in the HTML an option which allowed me to modify the source of my API calls.
So I created a variable that will react only if the term "production" is written, I added that in a script tag

I also imported my JS file :
![]()
And here is how I created my 2 functions that make a call according to the environment. And I create the markers according to the data received from the API :

To customize each marker, there are properties in the data to differentiate each marker, for example: a name, an address...
How to import a custom icon :
The particularity of Leaflet is that it is necessary to define a point of anchoring of the icons and the pop-ups otherwise the display is distorted, here are my choices which allow a correct display:

Here I define and create my new icons :

Leaflet allows customizing the markers, to do this, I went to my data to find the necessary code

How to empty the layers:

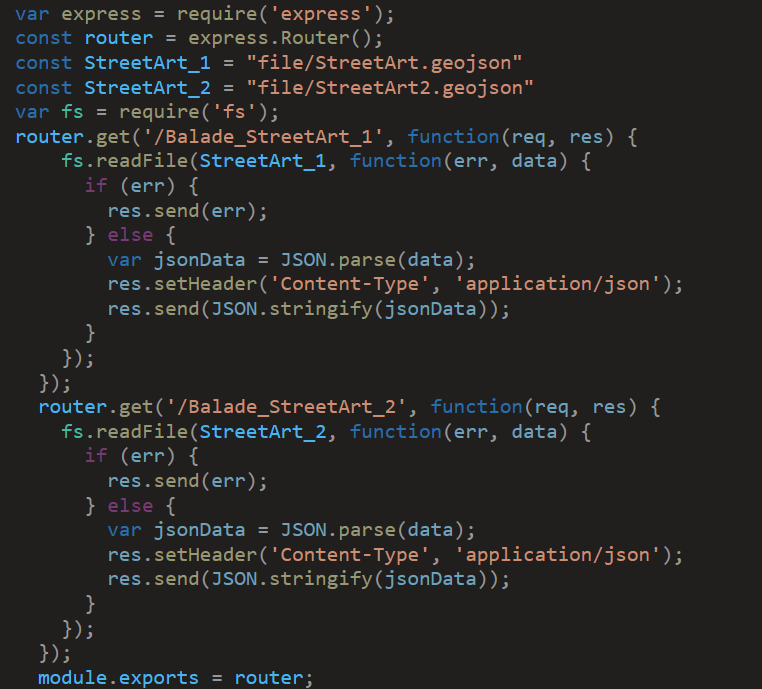
How I created the API :
To create an API for this map, I used Express.js:
I initialized the API by allowing corns in the server.js file

I created 2 routes, the first one for the data in points and the second one for the layouts:

For my bike stations, I created a specific path "Station" :
To start I call my router, and I define my files in variable while calling the "fs" module of Node.js

This function that I export on the way to my API:

For my second route, here is how I created it :
And this is how I created this simple map with an API.
If you want to try it, you can download the code on GitHub : website and for the API
You just need Node.js for running the API.
I hope you find some pleasure or help by reading this article.

Top comments (0)