
Performance monitoring is a very important topic for any application that expects to be deployed into a production environment. Performance monitoring is not something you should start considering once you start seeing performance issues, but rather, it should be part of your development process in order to detect possible problems before they are visible in production.
That being said, given the asynchronous nature of Node’s code, profiling it with regular tools can be challenging. Especially because part of the time spent could be outside of your code and inside the EventLoop itself. This is exactly why if the language provides you with the actual tools to profile it, you should seriously consider them.
In this article, I’m going to be covering practical examples of how to use the Performance Timing API, which is currently (as of this writing version 11.13) in experimental mode. Meaning, you’re welcome to use it, but keep in mind, they might change the actual contract of the methods we’re about to see from one version to the other without too much warning.

Of hooks & performance metrics
But before we get down to it, I want to quickly run over these two concepts, since they’re not exactly part of the same module, although using them together works great.
On the one hand, we have the Performance Timing API , which allows developers to take precise measurements of the effects of userland code in the event loop and how that affects the performance of your application. Basically, if you want to measure the performance of your app in a serious manner, you’ll want to read about “perf_hooks” at some point.
On the other hand though, there is another, unrelated module called “async_hooks”, which allows you to piggyback on the asynchronous mechanics of the V8 and add hooks (basically, function calls) that can be executed before, at the beginning, after and at the end of the life of an asynchronous resource (in other words, a callback function).
To put it simply, with this module you can perform actions at different stages of the life of a callback function (i.e right before it is called, and right at the end when it’s been garbage collected).
The point of mixing these two together is to be able to gather metrics from asynchronous operations without having to manually alter the code yourself. With these two modules, I’ll show you how to inspect the inner workings of some of your operations by inspecting the Event Loop. As you can probably guess, this will allow you to turn this ability on and off with very little effort and impact on your project. So now, let’s get down to some examples.
What can you do with the hooks?
When it comes to measuring time, both of these modules could be considered very low level, which means that although they might be a bit hard to understand at first, once you do, you can literally get in and measure every nook and cranny of your code. It’s up to you to define how deep the rabbit hole is.
Let me show you.
Measuring the time it takes to require your dependencies
To start, let’s look at the Performance Hook API, by itself, it is already quite powerful and allows you to gather some very interesting data.
For example, a problem that might appear on a project that relies too much on dependencies, is a slow boot-up time, due to a lot of time spent during dependency loading.
You could get a basic idea of where the bottlenecks are by adding this:
let start = (new Date()).getTime()
//your requires go here…
let end = (new Date()).getTime()
console.log(end — start, “ ms”)
Here you would find out how long your module takes to load, but what if you only have a couple of direct dependencies? Sometimes a single dependency can, in turn, depend on ten others, of which each one requires another ten. So you’re actually quite dependent and by doing such a shallow analysis with the previous code, you can’t really determine where exactly your problem comes from.
If instead, we focus our analysis with the help of the Performance Measurement API, we can overwrite the require function and capture every single require during the entire bootup process. Let me show you:
'use strict';
const {
  performance,
  PerformanceObserver
} = require('perf_hooks');
const mod = require('module');

// Monkey patch the require function
mod.Module.prototype.require = performance.timerify(mod.Module.prototype.require);
require = performance.timerify(require);

// Activate the observer
const obs = new PerformanceObserver((list) => {
  const entries = list.getEntries();
  entries.forEach((entry) => {
    console.log(`require('${entry[0]}')`, entry.duration);
  });
  obs.disconnect();
});
obs.observe({ entryTypes: ['function'], buffered: true });

require(‘getpass’);
The execution of the above code results in:
require(‘getpass’) 2.443011
require(‘getpass’) 2.432565
require(‘tty’) 0.003704
require(‘fs’) 0.003543
require(‘assert-plus’) 0.886344
require(‘assert’) 0.003409
require(‘stream’) 0.001784
require(‘util’) 0.001229
Here, we’re using two entities from the perf_hooks module.
Performance
This object provides the timerify method (amongst other methods of course). This method allows you to wrap a function around another one that will provide time measurements of the original one. This is what allows us to get the time data from require, we’re wrapping it (and it’s prototype) with timerify.
The PerformanceObserver class
This class allows you to create an instance of an observer and react when a new entry on the performance timeline has been made. Think about the timeline as a stack, you can only add data to the end of it, which means you add an entry.
So the observer allows you to set a handler function that gets called once the entry is pushed into the stack. The second to last line sets the observer’s target: entries with type equal to ‘function’ and makes sure the behavior is buffered. In other words, once all of the require calls end, our callback will be called.
This last bit is not required, you could very well structure the observer as follows:
const obs = new PerformanceObserver((list) => {
  const entry = list.getEntries()[0]
  console.log(`require('${entry[0]}')`, entry.duration);
});
obs.observe({ entryTypes: ['function'], buffered: false});
With a similar output:
require(‘tty’) 0.003969
require(‘fs’) 0.004216
require(‘assert’) 0.003542
require(‘stream’) 0.00289
require(‘util’) 0.002521
require(‘assert-plus’) 1.069765
require(‘getpass’) 4.109317
require(‘getpass’) 4.16102
The hidden magic bit here is that the entries aren’t being added by you directly, instead, they’re added by the wrapped require function. That is how timerify works, the returned function makes sure to add entries with type ‘function’ to the timeline, and our observer picks them up for us.
Now, you can imagine, if you’re inspecting the require chain of something like ExpressJS or request, the list will be longer.
Measuring your own code
Now I want to show you how to use the same observer, but on your own code, for that, we’ll have to manually trigger the measurements (we’ll see how to do that automatically using async hooks later, don’t worry).
For the measurements, we’ll be creating marks, which are just relevant points in our timeline, and then, we’ll measure the time between them to calculate our delays.
Specifically, the code below will perform four HTTP requests by getting the main page for some of the most popular search engines (Google, Yahoo!, Bing and DuckDuck Go). Once all four requests are done, we’ll simply print a word out to notify the user. For this example, we care about timing not what we do with the content.
The idea for our performance measurement of the code, is to calculate how long each request takes, and for that, we’ll create a single mark before the request is done, another one right when it ends and finally, we’ll measure the difference.
The code will look something like this:
'use strict';
const {
  performance,
  PerformanceObserver
} = require('perf_hooks');
const request = require("request")

function queryEngines(done) {
    const urls = [
        "http://www.google.com",
        "http://yahoo.com",
        "http://bing.com",
        "http://duckduckgo.com"
    ]

    let results = []

    urls.forEach( (url) => {
        performance.mark(url + "-init") //initial mark for the current URL

        request(url, (err, cnt) => {
            performance.mark(url + "-end") //final mark for the same URL
            performance.measure(url, url + "-init", url + "-end") //calculate the time difference between the start and end

            results.push(cnt)
            if(results.length === urls.length) {
                return done(results)
            }
        })
    })
}

// Activate the observer
const obs = new PerformanceObserver((list) => {
  const entry = list.getEntries()[0]
  console.log(`Time for ('${entry.name}')`, entry.duration);
});
obs.observe({ entryTypes: ['measure'], buffered: false});  //we want to react to full measurements and not individual marks

queryEngines( (pages) => {
    console.log("Done!")
})
The output looks like this:
Time for (‘http://www.google.com’) 155.920343
Time for (‘http://duckduckgo.com’) 435.809226
Time for (‘http://bing.com’) 679.744093
Time for (‘http://yahoo.com’) 3194.186238
Done!
Notice how for some reason, Yahoo! takes too long to return. If you look at the above code, for every URL we set a key point (mark) before the request and right when it returns, the measure method simply calculates the time difference and sends a trigger to the observer who then executes it’s callback and prints the data out.
Enter, the async hooks
By the nature of our code, the ability to hook onto asynchronous events will come in handy. Let’s first look at our code:
'use strict';
const {
  performance,
  PerformanceObserver
} = require('perf_hooks');
const async_hooks = require("async_hooks")

const request = require("request")

const map = new Map()

//Creating the async hook here to piggyback on async calls
const hook = async_hooks.createHook({
  init(id, type, triggerID, resource) {
    if (type == 'GETADDRINFOREQWRAP') {
        if(!firstMark) firstMark = resource.hostname + "-Init"
          performance.mark(resource.hostname + '-Init');
      map.set(id, resource.hostname)
    }
  },
  destroy(id) {

    if (map.has(id)) {
          let host = map.get(id)
      map.delete(id);
      performance.mark(host +"-After")
      performance.measure(host,
                          host + "-Init",
                          host + "-After")
    }
  }
});
hook.enable();


//Original code starts here
function queryEngines(done) {
    const urls = [
        "http://www.google.com",
        "http://yahoo.com",
        "http://bing.com",
        "http://duckduckgo.com"
    ]

    let results = []

    urls.forEach( (url) => {
        request(url, (err, cnt) => {
            results.push(cnt)
            if(results.length === urls.length) {
                return done(results)
            }
        })
    })
}


//The performance observer is not changed
const obs = new PerformanceObserver((list) => {
  const entry = list.getEntries()[0]
  console.log(`Time for ('${entry.name}')`, entry.duration);
});
obs.observe({ entryTypes: ['measure'], buffered: false});

queryEngines( (pages) => {
    console.log("Done!")
})
The output from that code is:
Time for (‘yahoo.com’) 10.285394
Time for (‘www.google.com’) 19.315204
Time for (‘bing.com’) 16.543073
Time for (‘duckduckgo.com’) 20.414387
Time for (‘www.bing.com’) 14.802698
Time for (‘yahoo.com’) 4.843614
Time for (‘www.yahoo.com’) 58.130851
Done!
There are several things to look at here. Let’s start at the beginning.
Creating the hook
The createHook method allows the developer to define a set of callbacks to be executed, depending on the name of the method it is assigned to. As I have already mentioned, there are four possible names to use here: init, before, after and destroy and they refer to a different step in the lifecycle of an asynchronous resource.
Defining the callbacks
Because we don’t really need that much control over what’s happening, I’m simply defining the first and the last of the callbacks to be called. This is in the hopes that I would be able to replicate the behavior of the previous example. As you can see, the result is not exactly the same though, and I will explain why in a bit.
The important part here is that you notice how I’m only sending a mark for the init event of asynchronous operations of type “GETADDRINFOREQWRAP”, these are related to HTTP requests. The parameters of the init method are:
- Id : An ID given to the particular asynchronous resource
- Type : Of a predefined list of types. You can take a look at the full lists in the docs, although sadly the official documentation doesn’t really explain much about them
- triggerID : The ID assigned to the function that created this particular asynchronous resource. Basically, the ID of the parent, you can follow the triggerID up the hierarchy all the way to the first parent
- Resource : Extra information about the object related to the resource. In particular, you can see how we’re accessing the hostname value using that object
And I’m also sending marks on the destroy event, as long as the associated asynchronous action is of interest (that’s where the Map plays a part). During this event, I’m not only sending the mark, but also sending the measurement for the entire process of a single URL.
The results
Although the logic behind the code is meant to be solid, the results that we get aren’t exactly what we were expecting, are they?! The two main differences are:
- The duration numbers don’t add up to what we got before, not even close
- There are more measurements than expected because some URLs are repeating
The difference in duration is due to the fact that we can’t attach specifically to the function we want. Maybe with more tinkering and debugging you can attain better results, but there are a lot of asynchronous resources involved during each request. With the current version of the code, we’re able to understand when the request starts, but not exactly when it ends, only when part of it ends. So the durations we’re getting are partials.
With that being said, our findings are still very much useful, because of the next difference.
As you can see, there are two requests to Bing and three to Yahoo!, if you think about it, even though the durations in the latest results don’t add up, the number of requests appear to explain why Yahoo! was the one taking the longest before. But why are we getting different results?
In order to debug the hooks, you can’t just use _console.log _, you can’t use any asynchronous functions, otherwise, the act of logging would, in fact, trigger another hook. So the recommended way to do so is by writing into a file, using the synchronous version of the writeFile method.
So you rewrite the init hook like so:
init(id, type, triggerID, resource) {
        let meta = {
            event: "[init]",
            type, id, triggerID
        }

        fs.writeFileSync("./perf.log", JSON.stringify(meta) + "\n\t", {flag: "a"} )
        for(let p in resource) {
        if(typeof(resource
) != "function") {
          fs.writeFileSync("./perf.log", "[resource ] " + p + ":" + util.inspect(resource

) + "\n\t", {flag: "a"} )
        }

        }
    if (type == 'GETADDRINFOREQWRAP') {
          performance.mark(resource.hostname + '-Init');
      map.set(id, resource.hostname)
    }
  },
In that code, I’m not just logging the basic data, but I’m also inspecting the resource object, trying to figure out what information is accessible, depending on the action type. In particular, you’ll find many TickObjects that reference the actual response object for the requests, and in them, you’ll find redirection requests. Particularly for Yahoo! and for Bing, the one that has multiple requests made.
In other words, by hooking into the ‘GETADDRINFOREQWRAP’ type of actions, we’re not just inspecting the request we manually perform, but the following requests that happen due to the mechanics of the HTTP protocol.
So, even though getting the same duration results turned out to be a bit difficult, by using the asynchronous hooks we get an insight into the inner workings of the code we wrote.
Conclusion
Both the performance hooks and the asynchronous hooks are still marked as experimental in Node’s official documentation, so if you start playing around with these modules, take that into account. There is nothing saying that these interfaces will change, but also, there is no real insurance that they will remain like they are right now.
That being said, playing around with these features is not a waste of time, because you get a glimpse of what might come in the near future as well as you gain the possibility of finding bugs and help the project by reporting them (or heck! Even fixing them).
Hopefully, this article helps you understand a bit the convoluted documentation and helps you make sense of it if you’re hoping to use this in your own code.
Let me know in the comments if you’ve used these modules or if you can think of another way to use them to gain even more insights!
Thanks for reading and see you on the next one!
Plug: LogRocket, a DVR for web apps
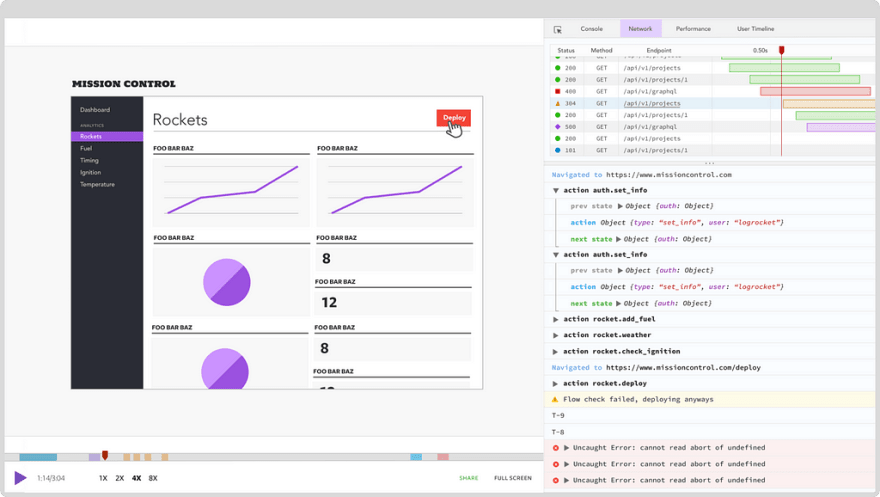
LogRocket is a frontend logging tool that lets you replay problems as if they happened in your own browser. Instead of guessing why errors happen, or asking users for screenshots and log dumps, LogRocket lets you replay the session to quickly understand what went wrong. It works perfectly with any app, regardless of framework, and has plugins to log additional context from Redux, Vuex, and @ngrx/store.
In addition to logging Redux actions and state, LogRocket records console logs, JavaScript errors, stacktraces, network requests/responses with headers + bodies, browser metadata, and custom logs. It also instruments the DOM to record the HTML and CSS on the page, recreating pixel-perfect videos of even the most complex single-page apps.
The post Experimental Node.js: Testing the new performance hooks appeared first on LogRocket Blog.

Latest comments (0)