
Written by Leigh Halliday✏️
Victory vs Recharts vs Nivo
React has a number of great charting options to choose from. Not all have the same charts available, but most touch on the staples, such as line, bar, and pie charts. We’ll be focusing on an area chart, which is similar to a line chart, but with the area underneath the line shaded in.
The charting libraries we will be looking at are Recharts, Victory, and Nivo. React-Vis is another nice option, but we’ll be focusing on the aforementioned three in this article, and on Recharts and Victory in this accompanying video.
The full source code can be found here.
Choosing a charting library
Assuming that multiple libraries can accomplish what you need to do, how you choose depends a little bit on preference and a little bit on what you value. Things I value when choosing a library are (in no particular order):
- Popularity: Are people using this library? Not that popularity means it is good, but it does mean it is more likely to be supported going forward
- Development: Is it still receiving regular updates and support?
- Issues: Are there a large number of issues open and are they being closed/triaged
- Documentation: Are there well-written examples and API documentation?
- Weight: In the browser, the weight (size this package adds to your JS bundle) is important, especially on slower mobile networks
- Look & feel: How does this package look visually?
- Ease of use: Is it easy to use and get up and running?
Here are a few high-level numbers and stats about the charting packages we are covering today:
- Recharts: 21k uses, 12.9k stars, 541 issues, 445kb bundle size
- Victory: 4k uses, 7.6k stars, 167 issues, 464kb bundle size
- Nivo: 6.1k stars, 128 issues, 389kb bundle size
- React-Vis: 3.8k uses, 6.6k stars, 242 issues, 307kb bundle size

Wrangling charting data
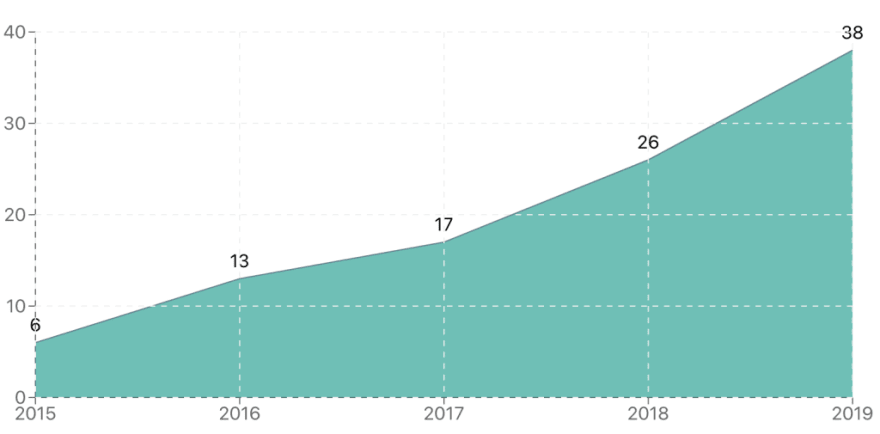
Charting always requires that you not only have data, but also that it is in the correct format required by the library. All three libraries we are working with want the data in an array of objects, with x and y as the keys:
const data = [
  { x: "2015", y: 6 },
  { x: "2016", y: 13 },
  { x: "2017", y: 17 },
  { x: "2018", y: 26 },
  { x: "2019", y: 38 }
];
The data above represents the number of repositories each year I have created (over my last 100 repos) on GitHub. Unfortunately, GitHub doesn’t provide the data in this format. I started by pulling the createdAt field using their GraphQL Explorer, with the following query:
{
  viewer {
    repositories(last: 100) {
      nodes {
        createdAt
        name
      }
    }
  }
}
It returned a result which resembles this abbreviated list below:
{
  "data": {
    "viewer": {
      "repositories": {
        "nodes": [
          {
            "createdAt": "2019-11-15T14:44:19Z",
            "name": "redux-context-reducers"
          },
          {
            "createdAt": "2019-11-30T22:26:28Z",
            "name": "mobx2020"
          },
          {
            "createdAt": "2019-12-11T20:58:05Z",
            "name": "victory-recharts-area"
          },
          {
            "createdAt": "2019-12-15T17:47:24Z",
            "name": "crime-mapping"
          }
        ]
      }
    }
  }
}
From this we can do some data wrangling in JavaScript to count how many times each year occurs, converting it into the desired format.
// Extract year from each repo createdAt
const repoYears = raw.data.viewer.repositories.nodes.map(repo =>
  parseInt(repo.createdAt.substr(0, 4), 10)
);

// Build object with each year initialized to 0
const years = {};
for (let i = Math.min(...repoYears); i <= Math.max(...repoYears); i++) {
  years[i] = 0;
}

// Populate years object with actual counts
const countsByYearObject = repoYears.reduce(
  (acc, year) => {
    acc[year] += 1;
    return acc;
  },
  { ...years }
);

// Convert object into array format victory wants
const countsByYear = Object.keys(countsByYearObject).map(year => ({
  x: year.toString(),
  y: countsByYearObject[year]
}));
Victory area chart

Victory is a great option if you also need to build a similar chart in React Native. It has great React Native support and the API is almost identical between it and the web version of the library. It actually doesn’t take very much code at all to produce a nice looking area chart.
import { VictoryChart, VictoryArea, VictoryTheme } from "victory";

function VictoryDemo() {
  return (
    <div style={{ maxWidth: "800px", margin: "0 auto" }}>
      <VictoryChart theme={VictoryTheme.material} width={800} height={400}>
        <VictoryArea
          data={data}
          labels={({ datum }) => datum.y}
          style={{ data: { fill: colors.teal } }}
        />
      </VictoryChart>
    </div>
  );
}
You can place multiple area/bar/line charts inside the VictoryChart container, allowing you to overlay data provided they share the same axes. Victory comes with a couple predefined themes to get your charts looking great, but you can always override these themes with your own values, like I did on the fill color using the style prop.
The width and height properties are in pixels, but they represent more of a ratio rather than an absolute. As you resize the screen, Victory will resize the chart to keep it from going outside of its parent container.
Recharts area chart
If Victory’s beauty is in its simplicity, Recharts shines when it comes to flexibility. Everything is a component in this package. From the AreaChart component, right down to the CartesianGrid component that draws that nice looking dashed grid onto the chart.
I personally have enjoyed working with Recharts a lot. Rather than complicated options, you can mix and match the components together to get exactly what you want. You can even combine multiple charts together within a single ResponsiveContainer.
Recharts doesn’t assume you will be passing your data with the labels x and y, which is why you have to specify the dataKey props on a number of the different components for it to know where to pull the data from.
import {
  AreaChart,
  XAxis,
  YAxis,
  CartesianGrid,
  Area,
  Tooltip,
  ResponsiveContainer,
  LabelList
} from "recharts";

function RechartsDemo() {
  return (
    <div style={{ maxWidth: "800px", margin: "0 auto", height: "400px" }}>
      <ResponsiveContainer>
        <AreaChart
          data={data}
          margin={{ top: 25, right: 25, bottom: 25, left: 0 }}
        >
          <XAxis dataKey="x" />
          <YAxis dataKey="y" />
          <Area
            dataKey="y"
            isAnimationActive={false}
            name="Repos"
            fill={colors.teal}
            stroke={colors.blueGrey}
          >
            <LabelList dataKey="y" position="top" offset={10} />
          </Area>
          <CartesianGrid stroke={colors.lightGrey} strokeDasharray="5 5" />
          <Tooltip />
        </AreaChart>
      </ResponsiveContainer>
    </div>
  );
}
Nivo area chart

Although I never covered Nivo in the video, it’s such a beautiful library with fantastic documentation that I wanted to include it in this article. The documentation is interactive, and you are able to change options and toggle properties to see in real-time what changes on the chart. It even updates the code as you change properties so that when it looks exactly how you want it to, you can copy and paste the code into your own project.
To produce an area chart, you will start with a line chart, filling in the area underneath the line with a simple option. This was done by passing enableArea={true} to the ResponsiveLine component. Nivo feels similar to Victory, in that you deal with fewer components which receive more props to customize the look and feel of the chart:
function NivoDemo() {
  return (
    <div style={{ maxWidth: "800px", margin: "0 auto", height: "400px" }}>
      <ResponsiveLine
        data={[
          {
            id: "repos",
            color: colors.teal,
            data
          }
        ]}
        margin={{ top: 25, right: 25, bottom: 25, left: 60 }}
        xScale={{ type: "point" }}
        yScale={{
          type: "linear",
          min: "auto",
          max: "auto"
        }}
        colors={d => d.color}
        enableArea={true}
        useMesh={true}
      />
    </div>
  );
}
Conclusion
Bringing data alive has always been fun for me. I enjoy wrangling the data into the correct format and then getting the chart to look just right. Charts can convey so much more information to a user than a simple table of numbers. In this article we compared building a very similar area chart in Victory, Recharts, and Nivo, allowing us to compare and contrast them, seeing what makes them tick.
Full visibility into production React apps
Debugging React applications can be difficult, especially when users experience issues that are difficult to reproduce. If you’re interested in monitoring and tracking Redux state, automatically surfacing JavaScript errors, and tracking slow network requests and component load time, try LogRocket.

LogRocket is like a DVR for web apps, recording literally everything that happens on your React app. Instead of guessing why problems happen, you can aggregate and report on what state your application was in when an issue occurred. LogRocket also monitors your app's performance, reporting with metrics like client CPU load, client memory usage, and more.
The LogRocket Redux middleware package adds an extra layer of visibility into your user sessions. LogRocket logs all actions and state from your Redux stores.
Modernize how you debug your React apps — start monitoring for free.
The post React area chart comparison appeared first on LogRocket Blog.

Top comments (0)