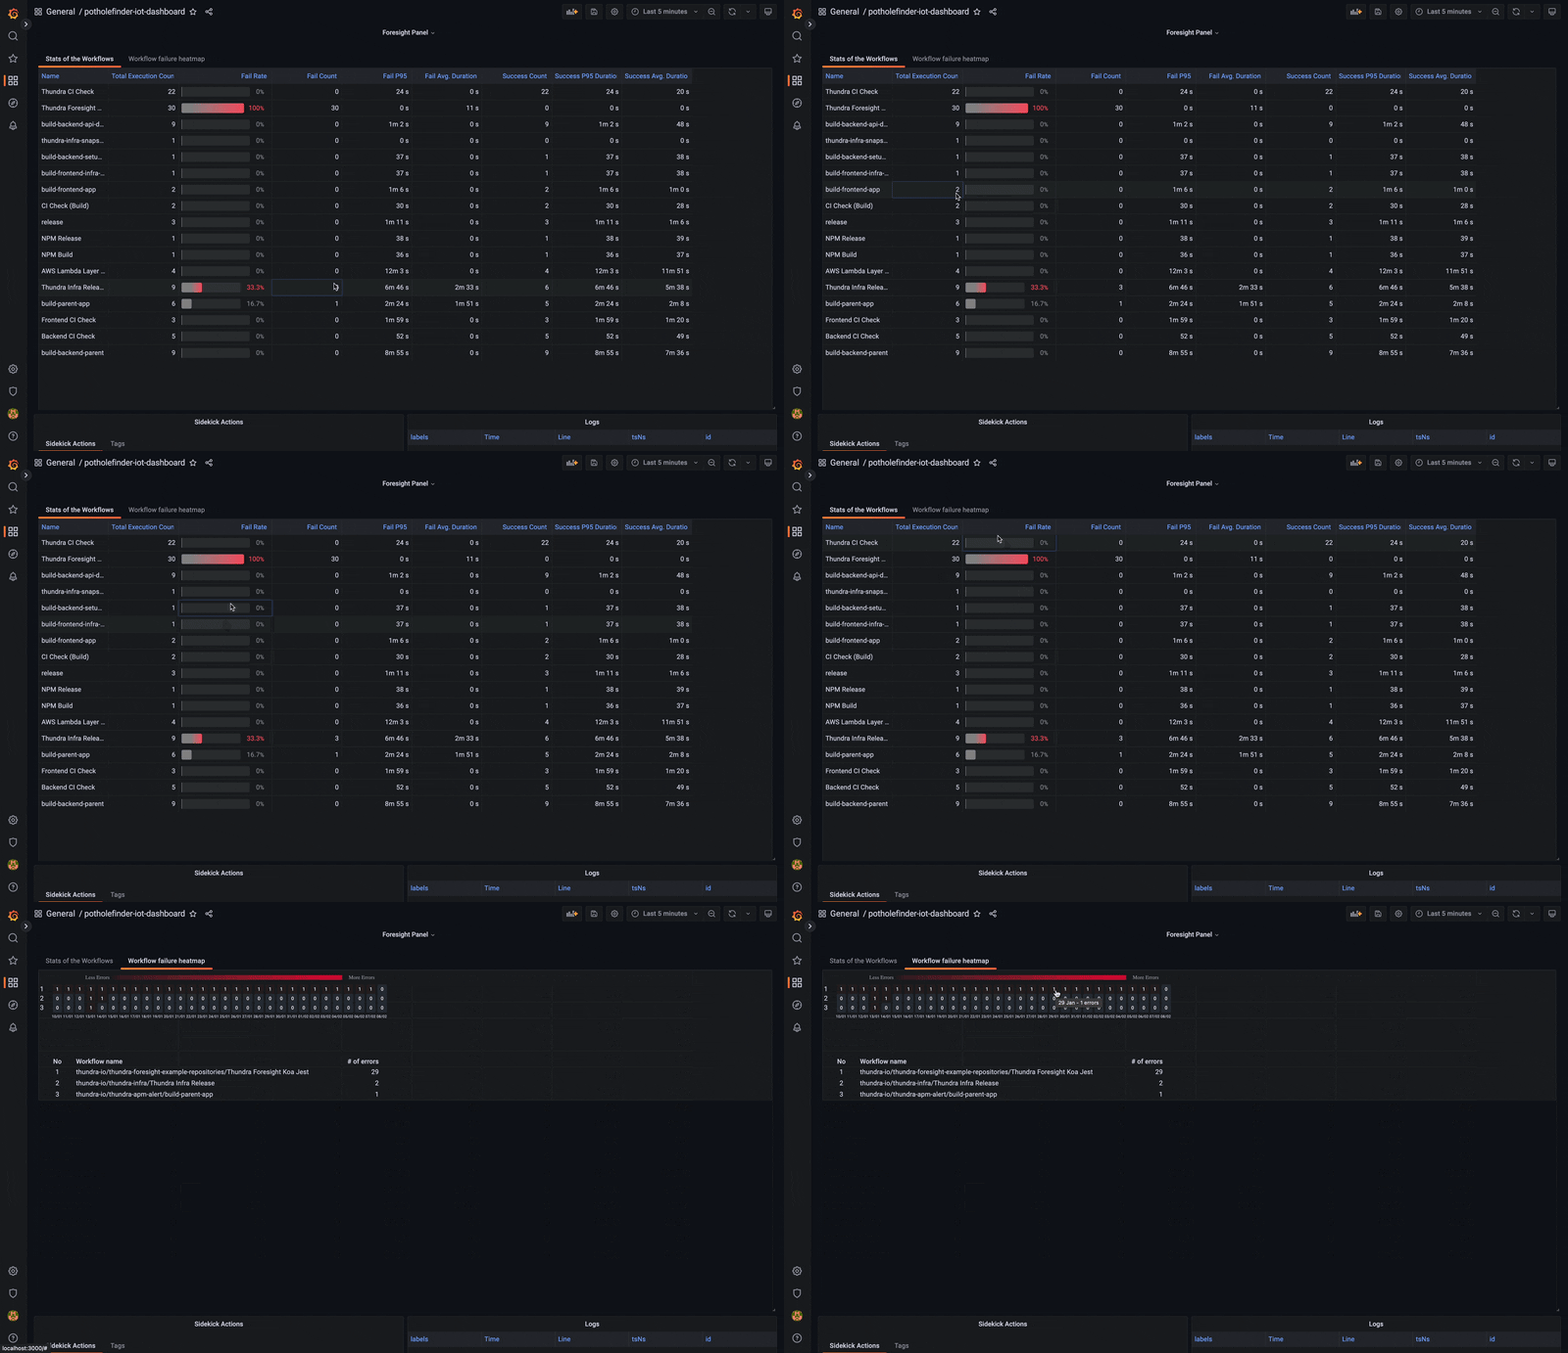
Grafana is an excellent tool for creating dashboards to gather data from various sources and serve them in a single place. According to Newstack, Grafana is the second most popular observability tool, counting 800,000 active installs and over 10 million users. These numbers also include some of our customers, and we have collected much feedback about bringing Foresight’s data & charts to Grafana Dashboards.
Using a dashboard like Grafana helps teams have a whole view of what the team is doing. Improving visibility and having a streamlined analysis for faster problem-solving. When technical issues arise, having all the data in a single place can help you solve them more quickly. Instead of spending time gathering data from multiple sources, you can access everything you need in one location. This can reduce downtime and minimize the impact of technical issues on productivity.
Makers define Grafana as “ the open source analytics & monitoring solution for every database” and we wanted to make Foresight one of those. Making it easier for our users to observe their CI workflow health & stats.
Introducing Foresight Plugin for Grafana!
Foresight is a powerful tool for monitoring and managing your continuous integration (CI) and testing workflows within GitHub Actions. With Foresight, you can easily track key metrics related to your workflows, such as build times, failure rates, etc. Now, with the Foresight plugin for Grafana, you can bring those insights directly into your Grafana dashboards. This plugin enables you to visualize Foresight’s workflow stats, and workflow failure heatmap features directly within Grafana, making it easier than ever to monitor the performance of your workflows and take action when issues arise. Whether you’re a developer, an operations team member, or a project manager, the Foresight plugin for Grafana can help you stay on top of your workflows and improve your team’s productivity.
This panel plugin comes with two tabs,
- Total execution count
- Fail & Success Rate
- Fail count
- Average Duration
- P95
- number of errors per day & workflow
Many more features are coming, and your feedback is highly appreciated.
In conclusion, Grafana is a powerful data visualization tool that can help you make sense of your technical data and increase productivity. By bringing all your technical data to a central location and visualizing it in meaningful ways, you can gain insights into your operations, identify areas for improvement, and make data-driven decisions that lead to greater efficiency. With the Foresight plugin for Grafana, you can take your data analysis to the next level by visualizing key CI and testing metrics directly within your Grafana dashboards. To learn more about Grafana and the Foresight plugin, check out the documentation today and explore the power of data-driven decision-making.
https://app.runforesight.com/signup
Originally published at https://www.runforesight.com.


Top comments (0)