Part 3: FoodGraph: a graph database to connect recipes and food data
Delicious Cuttlefish
After enriching data and developing ML and DL models to extract and classify elements from recipes, we in the Smart Recipe Project moved a step further connecting the data and the output of the services (see the previous posts) under a graph database architecture. The goal is the creation of a knowledge base, named FoodGraph, where the different recipe data information is connected together to form a deep net of knowledge.
In this two-section post:
(SECTION 1): we will give you some insights about the concepts and technologies used in designing a graph database;
(SECTION 2): we show you our method for converting JSON files, containing the recipe data, into RDF triples, the data model we chose for constructing the graph.
Graph database: key concepts
Graph databases are a NoSQL way to store and treat data and relationships among it, where relationships are equally important to data itself. In contrast to other approaches, the graph databases are initially designed to incorporate relationships since they store connections alongside the data in the model.
The building blocks of a graph database are:
- Nodes or vertex → They are the constructs standing for real-world entities participating in relationships.
- Edges or links → They represent connections and relationships among nodes and express the existing properties between the entities.

RDF: a data model to build the graph database.
RDF stands for Resource Description Framework (RDF) and is a data model that describes the semantics, or meaning of information. The core structure of an RDF model is a set of triples, each consisting of a subject, a predicate and, an object, which together form an RDF graph or a
triples store. Each RDF statement states a single thing about its subject (in purple) by linking it to an object (in red) by the means of a predicate (in red), the property.
<http://www.w3.org/TR/rdf-syntax-grammar><http://purl.org/dc/elements/.1/title> "RDF/XML Syntax Specification".
In the example, above the triple states “The technical report on RDF syntax and grammar has
the title RDF/XML Syntax Specification.”
Ontologies and Vocabularies.
An ontology represents a formal description of a knowledge domain as a set of concepts relationships that hold between them. To enable such a description, we need to formally specify components such as individuals (instances of objects), classes, attributes, and relations as well as restrictions, rules, and axioms. As a result, ontologies do not only introduce a sharable and reusable knowledge representation but can also add new knowledge about the domain and help data integration when data comes from different datasets.
Logic and Inferences.
Another important component of linked data is the possibility to perform inferences (or reasoning) on data though rules defined with data itself. Inference means that automatic procedures performed by inference engines (or “reasoners”) can generate new relationships based on data and some additional information in the form of an ontology. Thus the database can be used not only to retrieve information but also to deduce new information from facts in the data.
SPARQL.
SPARQL is an RDF query language, namely a semantic query language for databases, able to retrieve and manipulate data stored in RDF format. The results of SPARQL queries return the resources for all triples that match the specified patterns and can be result sets or RDF graphs.
Amazon Neptune.
Amazon Neptune is a graph database service that simplifies the construction and the integration of applications working with highly connected datasets. Its engine is able to store billions of relationships which can be speedily navigated and queried.
Convert JSON file to RDF
The first step for building the graph database consists of converting the JSON files, containing the recipe data, into RDF triples.
With few lines of code, we extracted data from the JSON file (using the Python library json) and converted it into RDF triples (in Turtle format), manually writing the RDF structure. This approach fits well with our task since the number of the data type to convert is relatively few.
The procedure to build the RDF triples consists in general of three steps:
- Prefix declaration → The prefixes identify the ontologies/vocabularies describing properties, classes, entities, and attributes used to build the graph. These elements indeed can be called in the triple via URI or using a namespace prefix. In Turtle format, the prefixes are introduced by a “@” and stand at the beginning of the Turtle document.
- Data extraction → using the Python library json, we extract the data contained in the json array. This data represents the nodes of the RDF graph.
- Writing RDF triples → using the data extracted and the ontologies declared, we manually write the RDF triples in a Turtle file. This data will be loaded on Amazon Neptune.
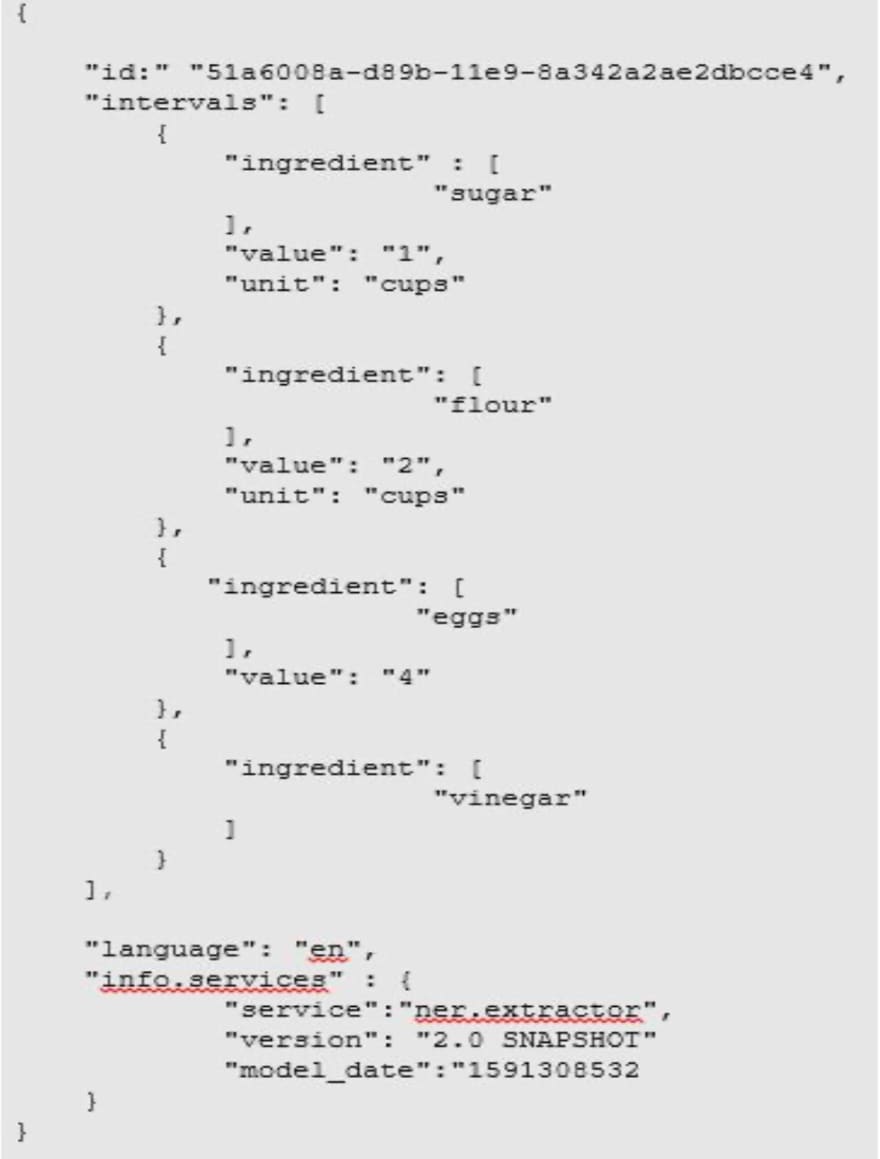
This is, for example, the JSON file containing 1) the output of the extractor service (see the previous post) and 2) other technical information of the NER model within the service:
This is the code we used to convert the JSON to RDF triples:
import json
import uuid

lang_dict = {
    "it": ("italian", "wiki:Q652"),
    "en": ("english", "wiki:Q1860"),
}

def lev2_rdfgraph(json_array, lang_dict):
    with open("path.ttl", 'w', encoding='utf-8') as lev2_rdfgraph:
    #prefix declaration
        lev2_rdfgraph.write("""@prefix recipe:<http//www.example.com/recipe/>.
        @prefix example:<http://www.example.com/>.
        @prefix schema:<https://schema.org/>.
        @prefix rdf:<http://www.w3.org/1999/02/22-rdf-syntax-ns#>.
        @prefix xs:<http://www.w3.org/2001/XMLSchema#>.
        @prefix dcterms:<http://purl.org/dc/terms/>.
        @prefix wiki:<http://wikidata.org/wiki/>.”””)

#data extraction
        for js in json_array:
            id_recipe = js['id']
            model_date = js['info_services']['model_date']
            language = js['language']
        #write rdf triples
        rdf_file.write("recipe:"+id_recipe+"\nschema:dateModified\n" + str(model_date)+".\n")
        #data extraction
       for chunk in js['intervals']:
           ingr, ingr_id  = "", ""
           for token in chunk['ingr']:
                ingr = str(ingr+token+" ")
                ingr_id = str(uuid.uuid4().hex()
                bnode_name = str(uuid.uuid4())
                #write rdf triples
                lev2_rdfgraph.write("recipe:"+id_recipe+"\nschema:material\n_:"+bnode_name+".\n")
                if 'unit' in chunk.keys():
                    lev2_rdfgraph.write(“_:”+bnode_name+”\nschema:materialExtent\n\”+str(chunk[“unit”])+”\”.\n”)
                if “value” in chunk.keys():
                lev2_rdfgraph.write("_:"+bnode_name+"\nrdf:value\n\""+str(chunk['value]')+“\”.\n)
           lev2_rdfgraph.write("_:"+bnode_name+"\nschema:recipeIngredient\nexample:"+ingr_id+".\n")
           lev2_rdfgraph.write("example:"+ingred_id+"\nxs:string\n\"+ingr.rstrip()+"\".\n\n")
     lev2_rdfgraph.write("recipe:" + id_recipe + "\n" + "dcterms:language" + "\n" +   lang_dict[language][1] + ".\n\n"
     lev2_rdfgraph.write(lang_dict[language][1] + '\nxs:string\n"' + lang_dict[language][0] + '".\n\n'

lev2_rdfgraph(json_array, lang_dict)
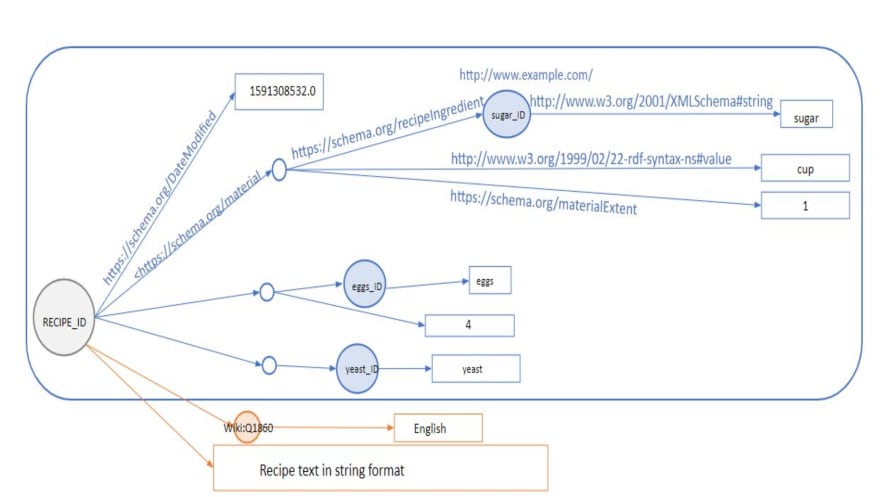
This is a graphic visualization for this piece of graph. The nodes represent the subject and the object of the graph, while the edges the predicates (for clarity, in the figure the properties are in the extended form and not called via prefix).
Food Graph is a three-level depth graph. Let’s discover the other levels of knowledge reading the Medium article.
When Food meets AI: the Smart Recipe Project
a series of 6 amazing articles
Table of content
Part 1: Cleaning and manipulating food data
Part 1: A smart method for tagging your datasets
Part 2: NER for all tastes: extracting information from cooking recipes
Part 2: Neither fish nor fowl? Classify it with the Smart Ingredient Classifier
Part 3: FoodGraph: a graph database to connect recipes and food data
Part 3. FoodGraph: Loading data and Querying the graph with SPARQL

Top comments (1)
Really enjoyed this! You explained a complex topic in such a clear way that it was easy to follow how the recipe data turns into a connected graph. The JSON-to-RDF part was especially interesting. Excited to see how FoodGraph grows—this is such a cool project.