Data is the present and the near future of human society. Since the world revolves around data analysis and statistics, it is no coincidence that the most in-demand jobs are data scientists or machine learning specialists. In this post, we'll show you how our data science team uses the power of data to help our customers to succeed in their businesses.
You might not have heard about us, as we are pretty new in the field. We're a company that allows clients to securely connect their vehicles and assets to know how they move.
astara Connect is a platform that acts as a neutral server storing mobility data. We digest the data coming from different providers (APIs, canbus, OEMs, OBD-II), normalize it, and keep it within our geospatial database. But one just does not simply save geospatial data and serve it.

We've created a platform that has intelligence and can interpret your vehicles' data (independently of their sources) and infer their journeys and behaviors.
So let's see how we squeeze the mobility data juice as much as possible.
We will use one of our client's data to show you how we have been helping them to improve their business decisions thanks to its data. This client, an on-demand vehicle subscription company, has hundreds of vehicles of different types: vans, cars and motorbikes, and other hubs around Spain. Henceforth, knowing how their vehicles move and work is vital for their success.
Buckle up! We're going to start talking about statistics and math.
First analysis
Let's start with the most basic analysis. The first step is visualizing the number of trips the client fleet performs during a period of time. The following figure shows our client's evolution of daily trips and trackers.
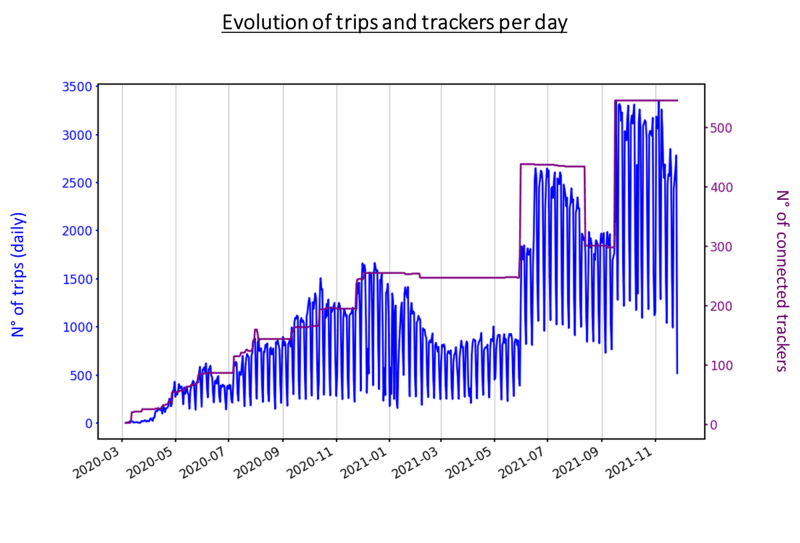
As it can be expected, the number of trips recorded per day depends linearly on the number of vehicles circulating. This conclusion can be simply deduced by observing the behavior of both overlapped plots: nº of trips and nº of vehicles connected to our platform. Our clients' fleet is wide in-vehicle varieties, including cars, motorbikes, and vans. Ergo, it may be interesting to aggregate the data by vehicle type and observe the results. The following figure groups the data by vehicle type.
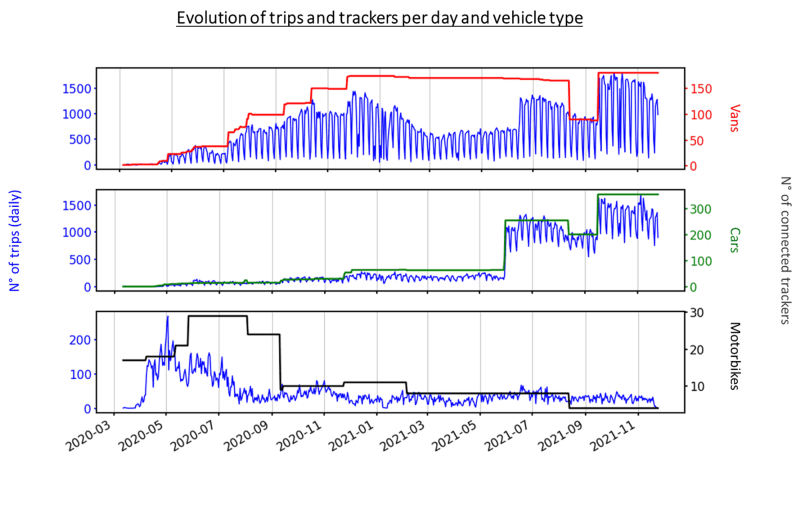
This aggregate graph follows the direction of our previous hypothesis. It confirms that, for every vehicle type, the number of trips recorded in our system is linearly proportional to the number of vehicles on the move and, therefore, generating positioning data.
Looking more deeply at the above figure, the time series of the number of trips appears to have a kind of oscillatory or sawtooth wave behavior. Furthermore, the periodicity looks lower than monthly. What do you think it could be? To find out, let's make a plot that will help us understand and clarify the origin of this behavior. The graph will represent the average number of trips per day of the week for each vehicle type.


Eureka! We have found something exciting. The sawtooth wave has a weekly frequency, and the signal behaves differently for each vehicle type. Let's break it per vehicle type:
- Vans travel during the working days of the week.
- Motorbikes are the opposite, and they move during the weekends (including Fridays).
- Cars signal follows the vans behavior but in a smoother way.
Thus, what have we learned from this quick analysis? First, considering that our client follows a subscription model with a diverse fleet, its subscribers could belong to a broad palette of businesses. With this brief study, we have been able to find out our client's business model, giving us insights about where there could be improvements. For instance, in the case of the vans, they are used primarily on working days (Monday to Friday), henceforth rented for business purposes, and more specifically for delivery or last-mile cases. On the other hand, motorcycles are focused on takeaway delivery. The graph shows that these vehicles move mostly during weekends (most takeout meals are served between Friday and Sunday). And in the case of cars, the signal tends to flatten, making the difference between weekends and weekdays smaller because they are rented for personal usage.
In summary, we have analyzed the temporal component of our client trips, but what happens with the spatial one? It is time to dig into the spatial mine and find out what is hidden inside.
The geospatial and temporal analysis
Let's begin putting all the trips on the map.
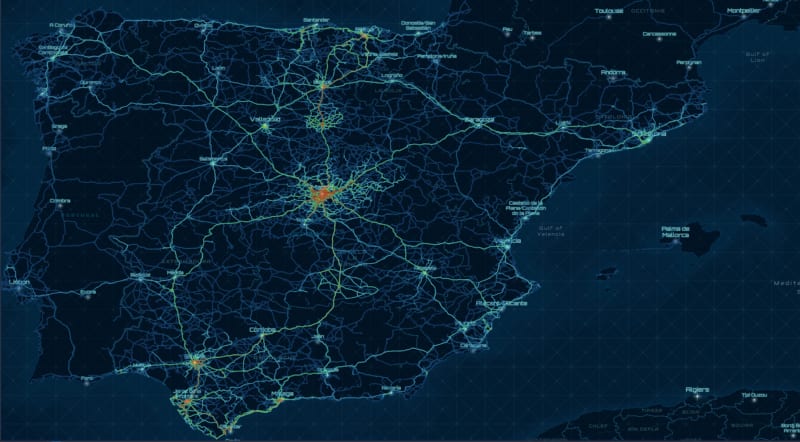
Indeed, the video is spectacular. Why? Because we used a blank map without drawing any traffic roads! Our client's vehicles have traveled the majority of Spanish highways and roads. We are trying to say that, merely with this representation of the trips, it is possible to undertake a new route map using vehicle positions from this client. Amazing!
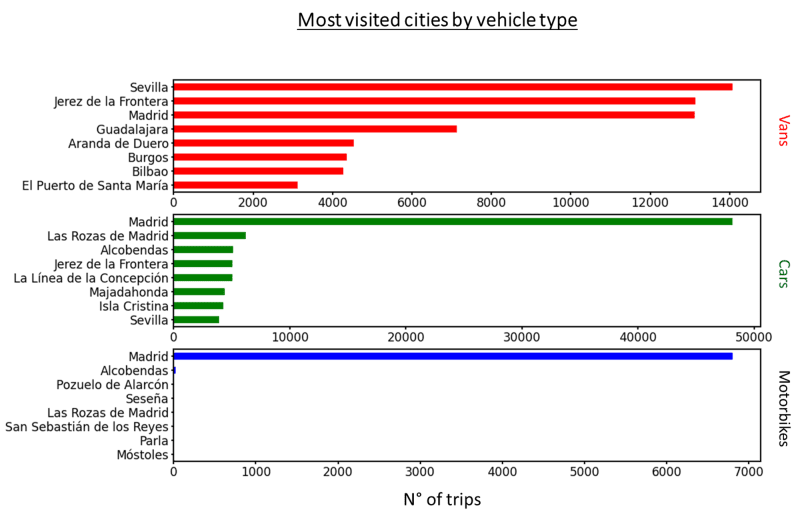
Now, knowing where the vehicles have been, let's go back to the business of our client. For them, it could be interesting to know which cities are the most visited ones, so we can infer the most demanded places to circulate or, for example, recommend a new investment in vehicle hubs.
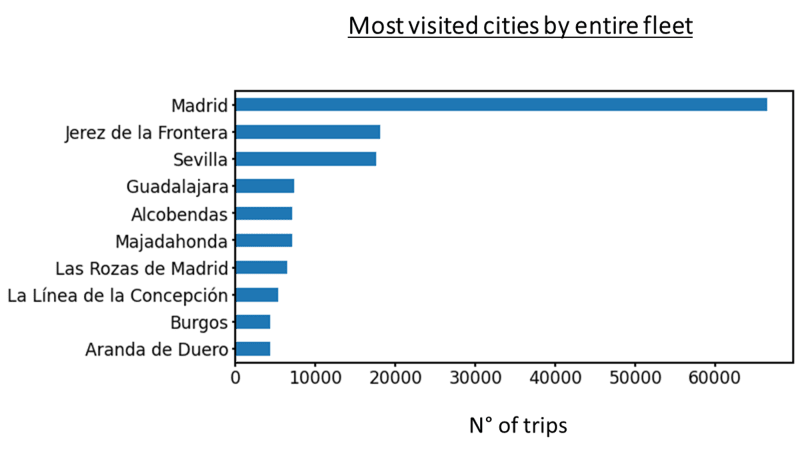
But we are not going to cut down the city's analysis yet. It is time to re-segment the results by vehicle type. Indeed, just by differentiating between types of vehicles, we could suggest which cars are the most interesting ones to store or park in a particular place. For example, it is clear that motorbikes are operating within the downtowns or close to the urban nucleus (Madrid in particular), so it makes no sense to have them available in hubs close to rural areas.
As a final touch, why not combine the spatial and temporal components of the trips in a single feature? For example, the following image shows you a great gif composed of heat maps from the previously analyzed data progressing through several days. This kind of representation can reveal how the business has been growing and how the influence areas are becoming more extensive.
In summary, we believe that by better understanding how your vehicles (or assets) move, we can help you grow your business, save money, and improve how your fleets move.
This study has shown one of our success cases. Simply analyzing the data of three different vehicle types with diverse business cases, we have managed to provide insights about their movement, where they go, and, more importantly, where there should be improvements for the business.
If you have a company where your business is moving vehicles, contact us, we will be more than happy to meet you!

Top comments (0)