I am an experienced software engineer diving into AI and machine learning. Are you also learning/interested in learning?
Learn with me! I’m sharing my learning logs along the way.
Disclosure: I have already learnt basic machine learning, but I am starting this learning log from the beginning because I need a refresher 😅.
Log #2: Cost Functions in Machine Learning
Cost functions indicate how well a machine learning model performs against a set of example data.
The output of a cost function is referred to as ‘the cost’ or ‘J’. A small cost suggests that the model performs well, which means that the difference between the model’s predicted value and the actual value is generally small. In contrast, a high cost suggests the opposite and that the difference between the predicted and actual values is considerable.
Different cost functions can exist for various machine-learning methods, even within a single machine-learning method! For instance, the cost function used on a regression model may differ from that on a classification model or neural network. We also have different cost functions for regression models, for example, mean error (ME), mean absolute error (MAE), mean squared error (MSE), etc.
Cost Functions in Model Training
Cost functions are essential for training a model. During training, we use them to determine the weights and biases for our model’s function.
Say I have a simple regression problem (covered in my last learning log). I have a series of example data (training data), each with one input feature (x) and the actual output (y).
Here is the function for the simple regression model:
f(x) = ŷ = wx + b
We refer to ‘w’ and ‘b’ as the parameters. Parameters of a model are variables that can be changed during training to improve the model.
During training, I want to find values for these parameters that produce a predicted value (ŷ) as close to the actual value (y) across all my example data.
We refer to the difference between ŷ (predicted) and y (actual) as the error. A cost function is a computed error across the set of example data; it factors each example data’s error in its calculation. In other words, it is a computed ‘collective’ error across the group of example data, not the error for a single example data!
Thus, when I write this above: “a predicted value (ŷ) as close to the actual value (y) across all my example data.”
I also mean “the lowest computed cost across all my example data.”
or “the lowest cost function across all my example data.”
We achieve this by experimenting with different parameters and calculating the cost at each step until we find values that yield the lowest cost.
The cost function is so important; without it, we would not determine how good specific parameters are and thus would be unable to choose optimal parameter values for our model. Our model is as good as the parameter values we choose for it.
Regression Cost Functions
I will only showcase some cost functions in this learning log and cover the rest in detail in future logs. At this stage, it is more important to understand why cost functions are essential and how we use them.
As I mentioned already, there are different types of cost functions. Here are some regression cost functions:
The most straightforward cost function is called mean error (ME). It works exactly how it sounds: the mean error across the set of example data. However, it is generally not recommended because the errors can be positive or negative, so adding them together may not reflect the collective error effectively.
An alternative cost function is the mean absolute error (MAE), where we can calculate the mean of the absolute values of the errors instead.
One of the most commonly used regression cost functions is the mean squared error (MSE). It is calculated by summing all the squares of the errors and dividing by the number of examples times 2, a.k.a calculating the mean of the squared errors and dividing the whole thing by 2. Note: some variations of MSE do not divide by 2, but including it makes the downstream derivation calculus cleaner.
Here is what the MSE cost function looks like in mathematical notation:

In some versions of the function, the output is the cost, ‘J’.
Visualising Cost
We can see the cost of a simple regression model by observing the difference between ŷ (value of y on the line) and y.

As we learned in the last learning log, we want the line to fit the example data as well as possible. Intuitively, the line of best fit would collectively have the most minor errors across the example data.
Cost Graph
We use another graph, the cost graph, to visualise the cost across different parameter values. For simplicity, let’s say that our model only depends on one parameter, θ. We can plot a graph with θ on the x-axis and the cost, J, on the y-axis.

Now, we can visualise the cost for all values of θ. The best value of θ would be the one that yields the lowest cost — the value of θ at the bottom of the U shape. The further we move from the optimal value of θ, the higher the cost and the worse the model.
As a general rule, the cost function graph for a regression problem will be U/bow/hammock-shaped. When there is only one parameter, we can visualise it in two dimensions, where it will look like a U shape. If there are two parameters, we can visualise it in three dimensions, and it will look more like a hammock.
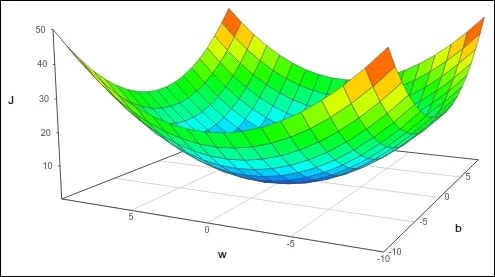
The same trend follows as we add more parameters, but visualisation becomes increasingly tricky.
Summary
- Cost functions are critical in machine learning.
- We use cost functions when training a model to determine how good the model is.
- During training, we continuously calculate the cost with different parameter values to decide which parameter values yield the best model.
- Different machine learning methods use different cost functions.
Disclosure
I am taking Andrew Ng’s Machine Learning Specialization, and these learning logs contain some of what I learned from it. It’s a great course. I highly recommend it!

Top comments (2)
Cool post, Victoria! 🙌 Part one was cool too — thanks so much for sharing some of your learnings from the course with us.
Just to note we have a built-in feature that allows folks to create a series on DEV. If you're interested, here's an article that explains how to set one up:
Best Practices for Writing on DEV: Creating a Series
Sloan the DEV Moderator for The DEV Team ・ Apr 17
Hope this info is helpful and thanks for sharing this post!
That's really good to know! Thanks for sharing :)