
This tutorial teaches you how to build a performant dynamic dashboard from your Supabase data in less than 15 minutes using Cube.
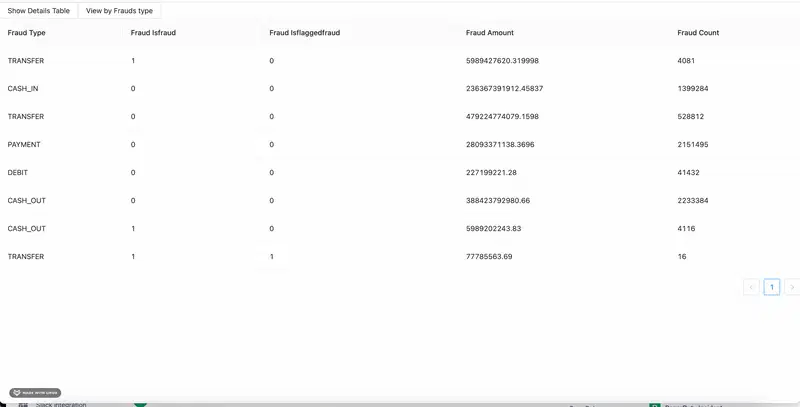
Here’s what we are building.
Get the completed code for this tutorial here.
You can also try the live demo app in this link.
Data visualization provides you with a graphical representation of your data. If you have massive datasets, data visualization can reveal trends and help you make data-driven decisions for your organizations.
However, there are many challenges when aggregating and visualizing massive datasets. This tutorial demonstrates how Cube can help you overcome these challenges.
Configuring our database
Let’s use a big dataset from kaggle for our demo application. I am going to use the online Payments Fraud detection datasets.
Next, head over to app.supabase.io and create a new database. Create a new table called fraud and import the CSV data. You can import CSV data using the import option in your Supabase dashboard, as shown in the following picture.
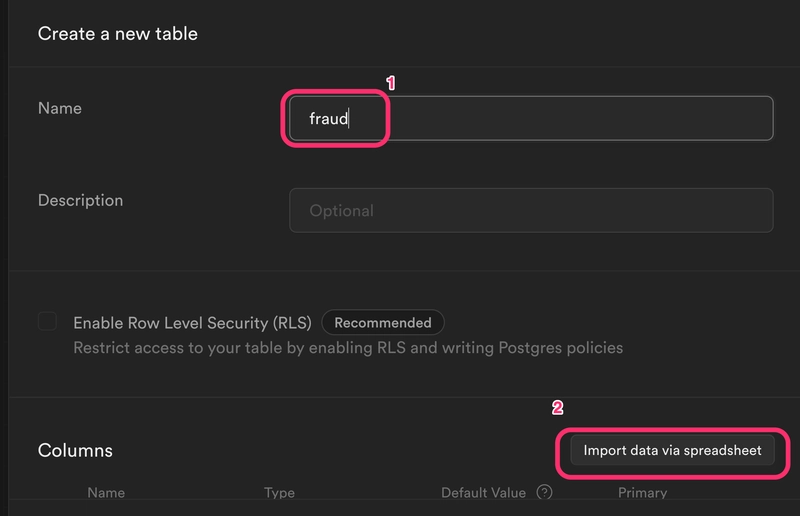
After some time the data will be uploaded and you will have a new fraud table with data.
Exploring queries for data visualization
Next, we are going to create and run some queries. Head over to the SQL editor in your Supabase dashboard menu and run the following query.
SELECT count(*) from fraud;

This query gives us the count of records in the fraud table. Let’s analyze the query time for this SQL query. Open up the developer tool in your browser and analyze the query execution time.

For me, it took about 4.32s, which is slow but not bad considering we are working with a dataset that has over 6 million rows. However, we rarely work with simple queries such as this one for complex data analysis. Let’s create a more complex query.
The following query fetches relevant columns such as fraud type, isfraud, isflaggedfraudand calculates the sum of fraud amount and counts frauds.
SELECT
  "fraud".type "fraud__type",
  "fraud"."isFraud" "fraud__isfraud",
  "fraud"."isFlaggedFraud" "fraud__isflaggedfraud",
  sum("fraud".amount) "fraud__amount",
  count(*) "fraud__count"
FROM
  public.fraud AS "fraud"
GROUP BY
  1,
  2,
  3
LIMIT
  10000;
This query takes about 6 seconds to run. For a modern application, this is not a very good response time.
Imagine a dashboard application that takes about 6 seconds for a single reporting table to load. It will not deliver a robust user experience. According to Google's market research, users get more frustrated as page load time goes over 3 seconds. If you build a public-facing data application and have a very slow response time, users are most likely to bounce from your website.
So what’s making the queries slow? Supabase is actually not the bottleneck here. Supabase uses PostgreSQL under the hood.
Postgres is a traditional Row oriented database. Row-oriented databases store information in the disk row by row.
| id | Name | City | Age |
|---|---|---|---|
| 1 | Dave | Los Angeles | 29 |
| 2 | Matt | Toronto | 26 |
| 3 | Jeff | New York | 23 |
These types of databases are very efficient at reading and writing single rows. For instance, if I want to add a new record, I can add another row to the end of the table. If I know the id of a record, I can look up the row and read all the columns.
This makes Postgres a great database for applications that heavily depend on reading and writing data.
However, when executing aggregation row-oriented databases are not performant. For instance, if I want to get the sum of all the ages in the previous table, I must read each row and all its columns. Then I have to add up the age values. Even though we only need the age column, we read all the columns, which is not very memory efficient. Therefore Postgres has its shortcoming in data-intensive aggregations and analytics tasks.
You can learn more about how Row oriented databases work and their limitations in this blog post.
Column-oriented databases such as BigQuery, and Snowflake is really good at aggregating data. However, it is often more challenging to manage and sync multiple databases of different paradigms when building applications.
How does Cube resolve this issue?
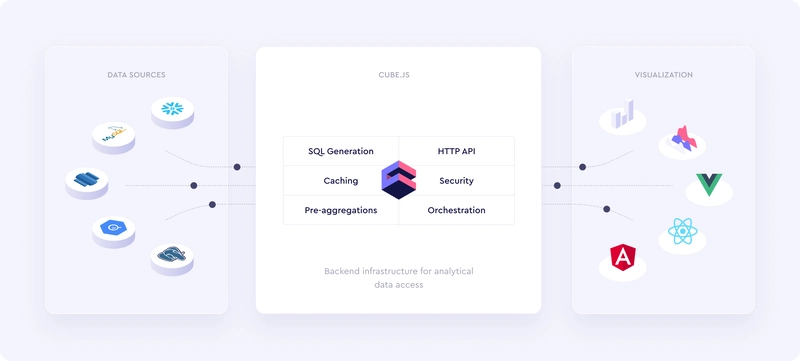
Cube is an open-source API-first headless business intelligence platform that connects to your data sources and makes queries fast, responsive, cost-effective, and consistent across your applications. Cube’s API layer is able to perform efficient aggregation on your data and serve it to applications.
You run your Cube API as a service (following the microservices architecture pattern). The following diagram demonstrates the overall application architecture with Cube.
Getting started with Cube
The easiest way to get started with Cube is with Cube Cloud. It provides a fully managed Cube cluster ready to use. However, if you prefer self-hosting, then follow this tutorial.
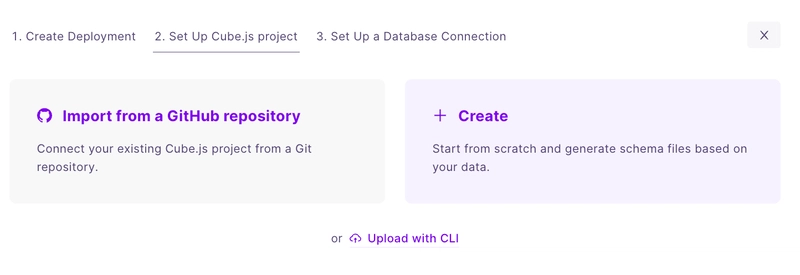
In this tutorial, you will create a new Cube deployment in Cube Cloud. You can select a cloud platform of your choice.
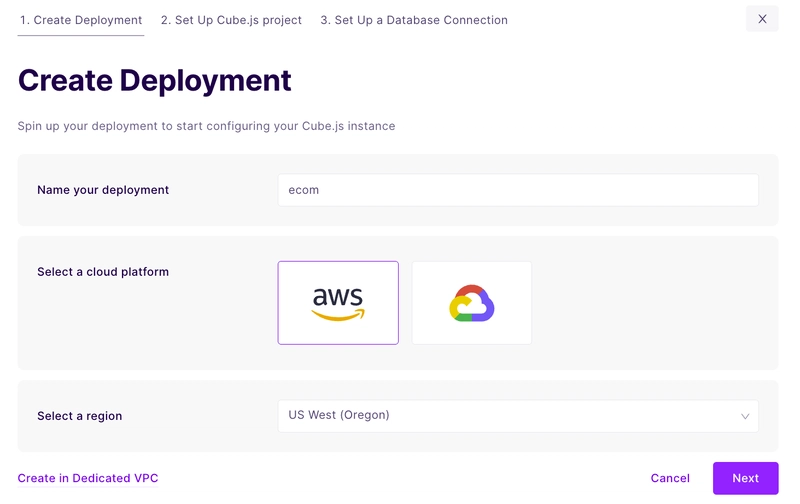
Next, select start from scratch to get started with a fresh instance.
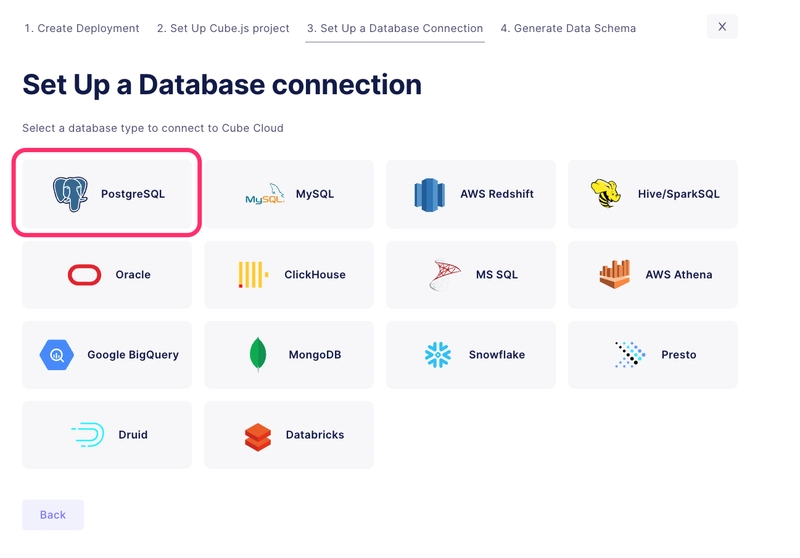
Next, you will be asked to provide your database connection information. Select PostgreSQL.
Head back to your Supabase dashboard to retrieve the database connection information. From there please select the Database option and take note of the connection information.
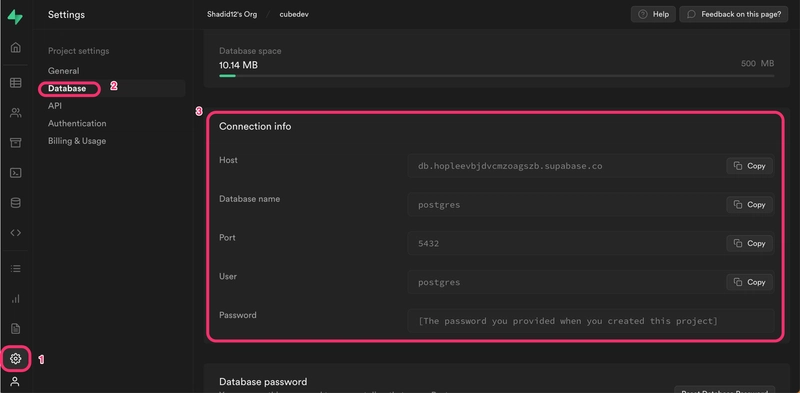
Next, fill in the database connection information in Cube Cloud.
Hostname:  <your-supabase-db-id>
Port:      5432
Database:  postgres
Username:  postgres
Password:  <your-supabase-password>
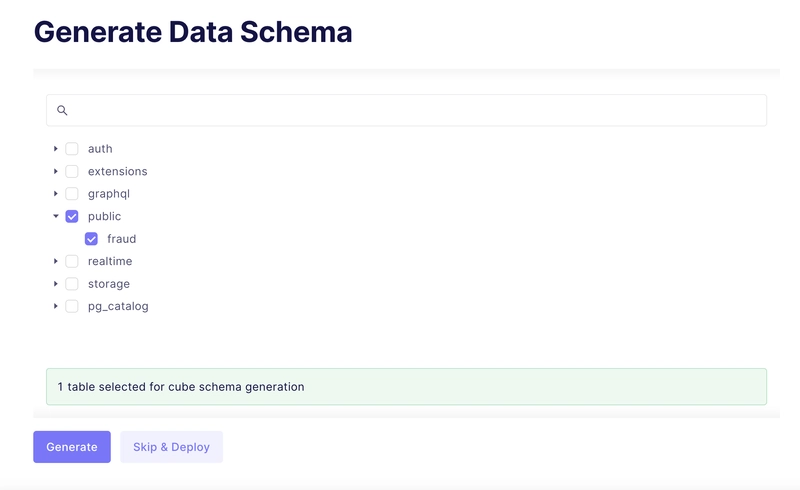
Cube can auto-generate a Data Schema from your SQL tables. A Cube Data Schema is used to model raw data into meaningful business definitions. The data schema is exposed through the querying API, allowing end-users to query a wide variety of analytical queries.
We will select the fraud table for schema generation. It will take a couple of minutes for our Cube instance to get provisioned.
Create pre-aggregations in Cube to increase query performance****
One of Cube’s most used features are pre-aggregations. Pre-aggregations reduce the execution time of a query.
In Cube, pre-aggregations are condensed versions of the source data. They are materialized ahead of time and persisted as tables separately from the raw data. To learn more about pre-aggregations follow this tutorial.
We have also created in-depth video workshops on pre-aggregations. Feel free to check them out as well.
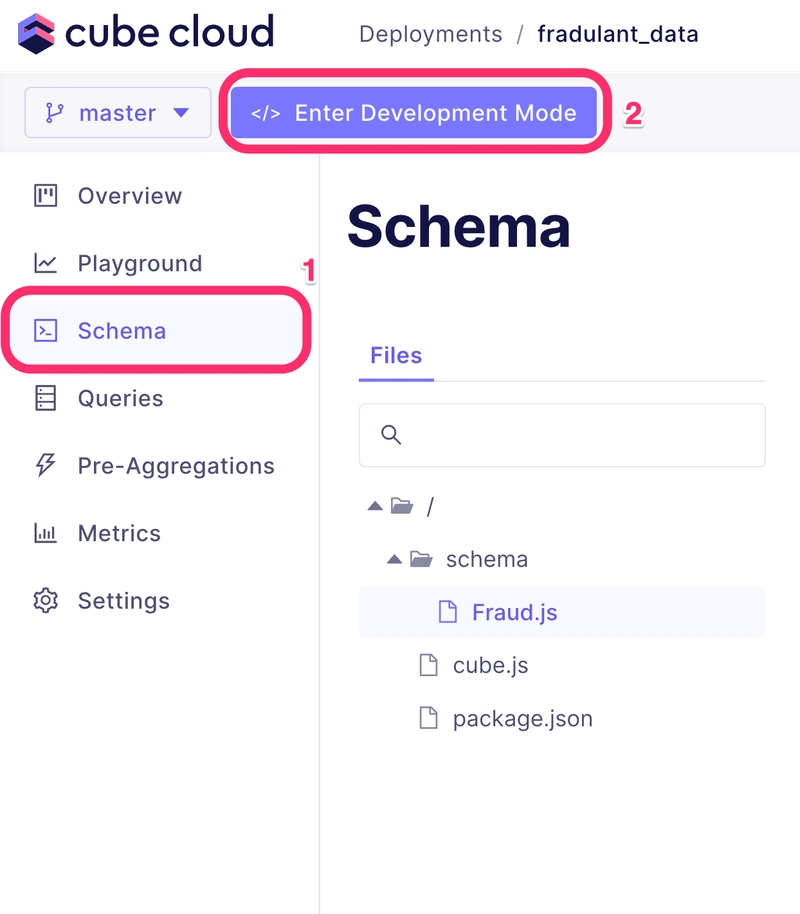
In your Cube dashboard select Schema and then select Enter Development Mode. Select Fraud.js in the files and add the following code to your schema.
// Fraud.js

cube(`Fraud`, {
  sql: `SELECT * FROM public.fraud`,
  preAggregations: {
    main: {
      measures: [Fraud.amount, Fraud.count],
      dimensions: [Fraud.type, Fraud.isfraud, Fraud.isflaggedfraud, Fraud.nameorig]
    }
  },
  joins: {},
  measures: {
    count: {
      type: `count`,
      drillMembers: [nameorig, namedest]
    },
    amount: {
      sql: `amount`,
      type: `sum`
    }
  },
  dimensions: {
    type: {
      sql: `type`,
      type: `string`
    },
    nameorig: {
      sql: `${CUBE}."nameOrig"`,
      type: `string`
    },
    oldbalanceorg: {
      sql: `${CUBE}."oldbalanceOrg"`,
      type: `string`
    },
    newbalanceorig: {
      sql: `${CUBE}."newbalanceOrig"`,
      type: `string`
    },
    namedest: {
      sql: `${CUBE}."nameDest"`,
      type: `string`
    },
    isfraud: {
      sql: `${CUBE}."isFraud"`,
      type: `string`
    },
    isflaggedfraud: {
      sql: `${CUBE}."isFlaggedFraud"`,
      type: `string`
    }
  }
});
Please save the changes and the pre-aggregation will be applied to your SQL queries.
Analyzing data with the Developer Playground
Select the developer playground option from your Cube dashboard. The Developer Playground is a tool that lets you experiment with your data and generate various data visualizations.
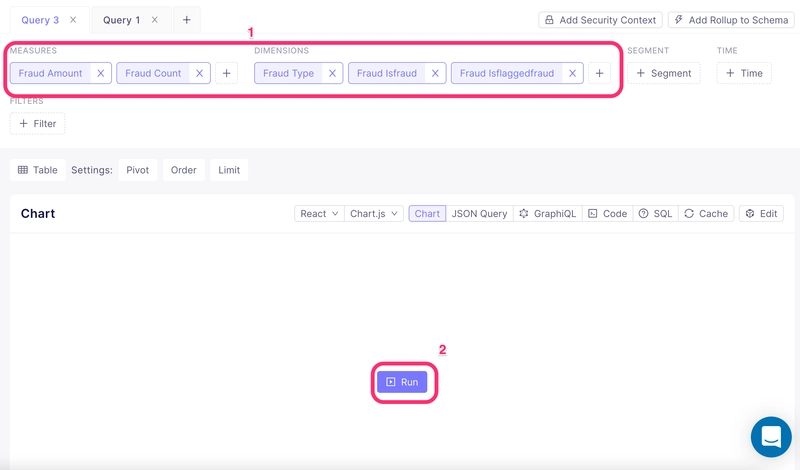
Let's create a new Query. Please select the measures and dimensions as shown in the following image and then select Run. It makes an identical query to our previous SQL query.
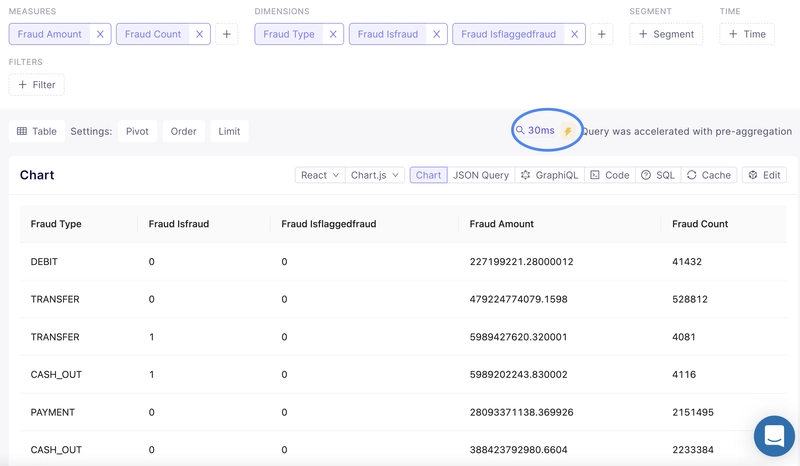
Notice that it takes only about 30 to 35 milliseconds to run the query and get the data back. That’s almost a 200x performance boost in the best-case scenario.
Autogenerate front-end code from Cube
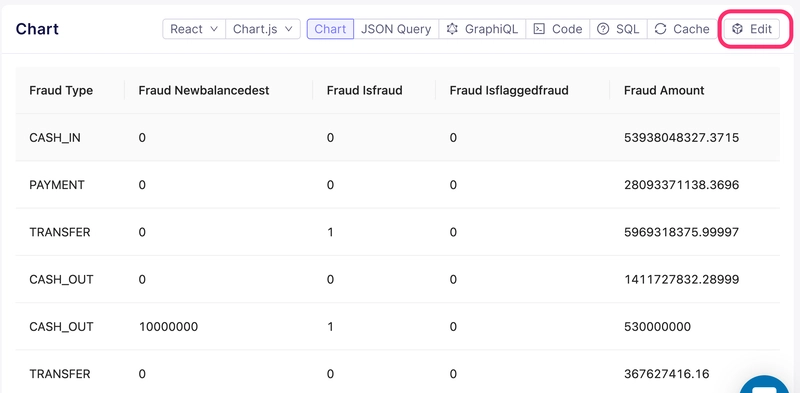
Cube also gives us the ability to autogenerate part of our front-end code. For instance, if we want the table in the previous example as a React component, we can generate it from Cube.
In your Chart menu select the Edit option and Cube will create a new table component in the codesandbox.
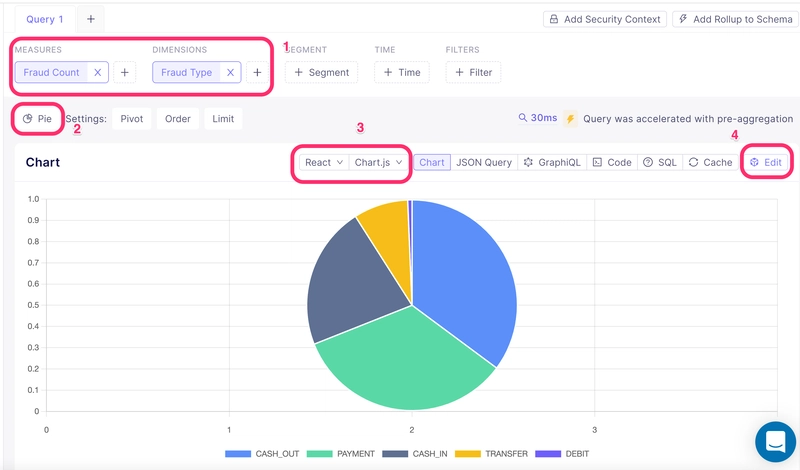
Next, let’s say we want to visualize the number of different types of frauds committed. We want to present this information as a pie chart. We can select Count as measures and Type as dimensions in the Cube dashboard to do this. We select the Pie chart option. We can also specify that we want React and the Chart.js library to generate our visualization.
Once the visualization is done you can open the front-end code by selecting Edit.
Putting it all together in a React App
Let’s put together a front-end React app for our data visualization. Create a new React app by running the following commands.
$ npx create-react-app supabase-demo
$ cd supabase-demo
Next, add all the required npm dependencies to your project.
$ npm i @cubejs-client/core \
        antd \
        use-deep-compare \
        recharts \
        @cubejs-client/react --save
First of all we initialize cube by adding the following code to our App.js file.
import { useState } from 'react';
import cubejs from "@cubejs-client/core";
import { Button } from 'antd';
import TableRenderer from './components/Table';
import PieChart from './components/PieChart';
import ChartRenderer from './components/BarChart';
import { CubeProvider } from '@cubejs-client/react';

const cubejsApi = cubejs(
  "eyJhbGciOiJIUzI1NiIsInR5cCI6IkpXVCJ9.eyJpYXQiOjE2NTMyODIzNDQsImV4cCI6MTY1NTg3NDM0NH0.6__5oRpMmh8dEbBmhN-tkFOVc-B8CNU8IkxX7E_z5XI",
  {
    apiUrl: "https://inherent-lynx.aws-us-east-1.cubecloudapp.dev/cubejs-api/v1"
  }
);

function App() {
  const [showPieChart, setShowPieChart] = useState(false);

  return (
    <CubeProvider cubejsApi={cubejsApi}>
      <div className="App">
        <div>
          <Button onClick={() => setShowPieChart(false)}>Show Details Table</Button>
          <Button onClick={() => setShowPieChart(true)} >View by Frauds type</Button>
        </div>
        {
          showPieChart ? (
            <>
              <PieChart />
              <ChartRenderer />
            </>
          ) : <TableRenderer />
        }
      </div>
    </CubeProvider>
  );
}

export default App;
Next, go ahead and create two components one for showing the table view and the other for showing the Pie chart. Following is the code for the Table component.
// partials of src/components/Table.js

import { useEffect, useState, useContext } from "react"
import { CubeContext } from '@cubejs-client/react'
import { Spin, Table } from "antd"

// Declaire Pivot Configuration [Constant for each chart]
const pivotConfig = {
  x: [
    "Fraud.type",
    "Fraud.newbalancedest",
    "Fraud.isfraud",
    "Fraud.isflaggedfraud"
  ],
  y: ["measures"],
  fillMissingDates: true,
  joinDateRange: false
}

const TableRenderer = () => {
  const { cubejsApi } = useContext(CubeContext);
  const [data, setData] = useState(null)
  const [error, setError] = useState(null)
  const [columns, setColumns] = useState([])

  useEffect(() => {
    // Load data from Cube.js API on component mount
    cubejsApi
      .load({
        "measures": [
          "Fraud.amount",
          "Fraud.count"
        ],
        "timeDimensions": [],
        "order": {
          "Fraud.nameorig2": "desc"
        },
        "dimensions": [
          "Fraud.type",
          "Fraud.isfraud",
          "Fraud.isflaggedfraud"
        ],
        "limit": 10000
      })
      .then((resultSet) => {
        setColumns(resultSet.tableColumns(pivotConfig));
        setData(formatTableData(columns, resultSet.tablePivot(pivotConfig)))

      })
      .catch((error) => {
        setError(error);
      })
  }, [])

  if(!data) {
    return <Spin />;
  }

  return (
    <Table
      columns={columns}
      pagination={true}
      dataSource={data}
    />
  )
}

// helper function to format data
const formatTableData = (columns, data) => {
  function flatten(columns = []) {
    return columns.reduce((memo, column) => {
      if (column.children) {
        return [...memo, ...flatten(column.children)];
      }

      return [...memo, column];
    }, []);
  }

  const typeByIndex = flatten(columns).reduce((memo, column) => {
    return { ...memo, [column.dataIndex]: column };
  }, {});

  function formatValue(value, { type, format } = {}) {
    if (value == undefined) {
      return value;
    }

    if (type === "boolean") {
      if (typeof value === "boolean") {
        return value.toString();
      } else if (typeof value === "number") {
        return Boolean(value).toString();
      }

      return value;
    }

    if (type === "number" && format === "percent") {
      return [parseFloat(value).toFixed(2), "%"].join("");
    }

    return value.toString();
  }

  function format(row) {
    return Object.fromEntries(
      Object.entries(row).map(([dataIndex, value]) => {
        return [dataIndex, formatValue(value, typeByIndex[dataIndex])];
      })
    );
  }

  return data.map(format);
};

export default TableRenderer;
Following is the code for PieChart component.
// PieChart.js

import { QueryRenderer } from "@cubejs-client/react";
import { CubeContext } from '@cubejs-client/react';
import { Spin } from "antd";
import "antd/dist/antd.css";
import React, { useContext } from "react";
import {
  PieChart,
  Pie,
  Cell,
  Tooltip,
  ResponsiveContainer,
  Legend
} from "recharts";

const colors = ["#FF6492", "#141446", "#7A77FF", "#FFB964"];

const renderChart = ({
  resultSet,
  error,
  pivotConfig,
  onDrilldownRequested
}) => {
  if (error) {
    return <div>{error.toString()}</div>;
  }

  if (!resultSet) {
    return <Spin />;
  }

  return (
    <ResponsiveContainer width="100%" height={350}>
      <PieChart>
        <Pie
          isAnimationActive={true}
          data={resultSet.chartPivot()}
          nameKey="x"
          dataKey={resultSet.seriesNames()[0].key}
          fill="#8884d8"
        >
          {resultSet.chartPivot().map((e, index) => (
            <Cell key={index} fill={colors[index % colors.length]} />
          ))}
        </Pie>
        <Legend />
        <Tooltip />
      </PieChart>
    </ResponsiveContainer>
  );
};

const ChartRenderer = () => {
  const { cubejsApi } = useContext(CubeContext);
  return (
    <QueryRenderer
      query={{
        measures: ["Fraud.amount"],
        timeDimensions: [],
        order: {
          "Fraud.amount": "desc"
        },
        dimensions: ["Fraud.type"]
      }}
      cubejsApi={cubejsApi}
      resetResultSetOnChange={false}
      render={(props) =>
        renderChart({
          ...props,
          chartType: "pie",
          pivotConfig: {
            x: ["Fraud.type"],
            y: ["measures"],
            fillMissingDates: true,
            joinDateRange: false
          }
        })
      }
    />
  );
};

export default ChartRenderer;
You can find the complete code for this demo application at this link.
Where to go from here
We have only covered the basics of Cube in this tutorial. Cube comes packed with features that can help you build data-intensive apps fast. Cube supports features such as multiple database connections, multi-tenancy, GraphQL API, SQL API, and more.
You can sign up for Cube Cloud for free if you would like to play around. To learn more about how Cube can help you to build your project head over to the official documentation page.
If you have questions, or feedback, we would love to hear what you have to say! Come join our Slack community. Click here to join!
That’s all for today. Feel free to leave Cube a ⭐ on GitHub if you liked this article. Happy hacking.

Top comments (0)