Introduction
Tracking down what happens in JavaScript code is not always trivial, especially when many event handlers and/or asynchronous ajax calls are involved. Using console.log in these cases can be tiresome and ineffective, in this article I am going to show the basics how to use Chrome DevTools for debugging JavaScript.
Getting started
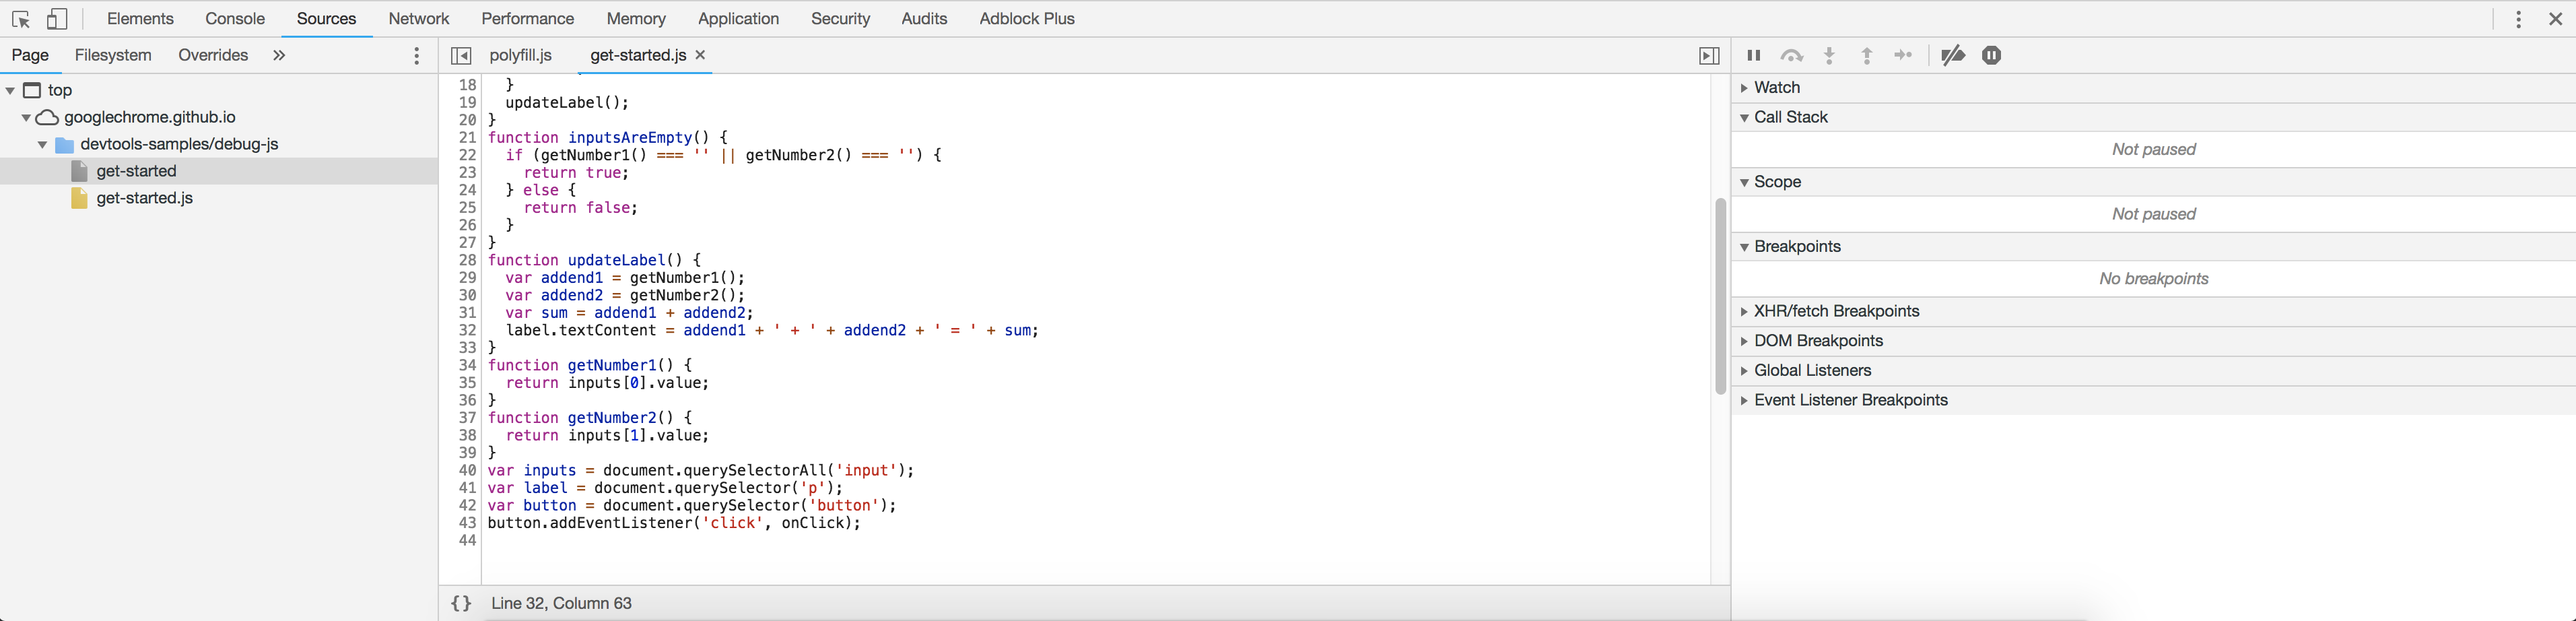
Open the inspector (Cmd+Option+i or Ctrl+Shift+i), and navigate to the Sources tab, and choose the JavaScript file you want to debug on the navigation bar on the left hand side.
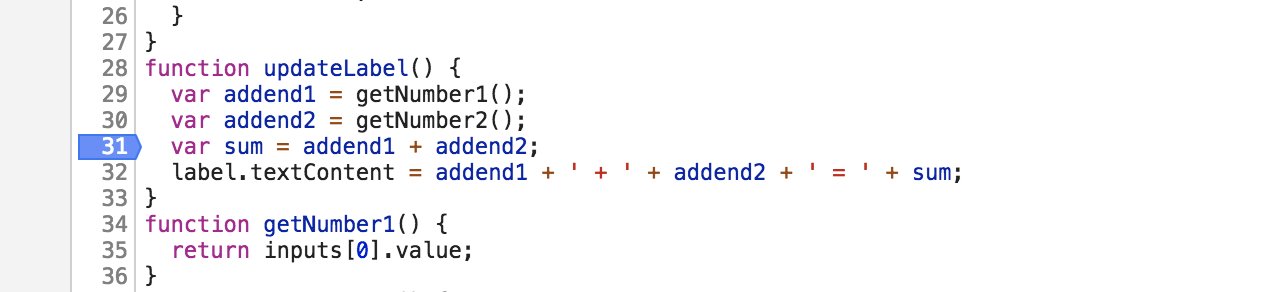
Add breakpoint by clicking on the line number:
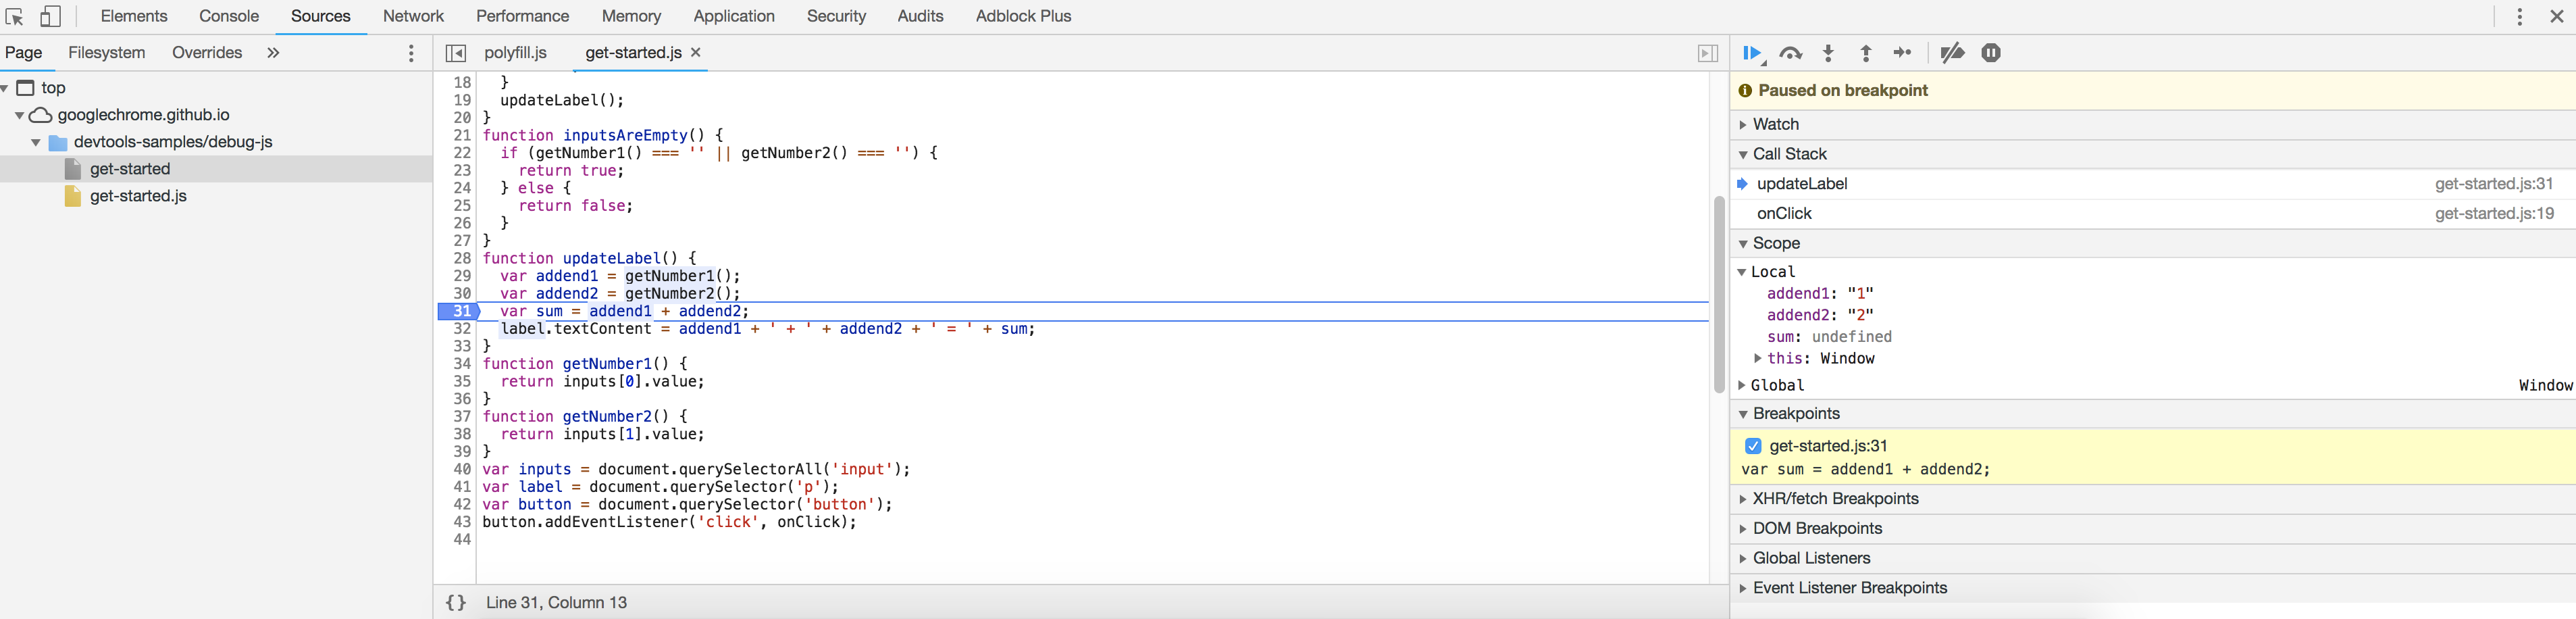
Run the code in the browser, when the debugger stops, you can use the usual things to debug your code including:
- Step into function – F11
- Step over – F10
- Step out of function call – Shift + F11
- Watch variables
- Inspect local variables
Additional useful features
I’ve recently learned some very handy features to use while debugging.
debugger
Adding debugger; command to the code the debugger stops executing the code, it is a very quick way to add a breakpoint, no need to browse the source files in the devtools.
console.table()
Similar to the console.log, but it shows the variable as a table, useful to quickly check values of complex variables.
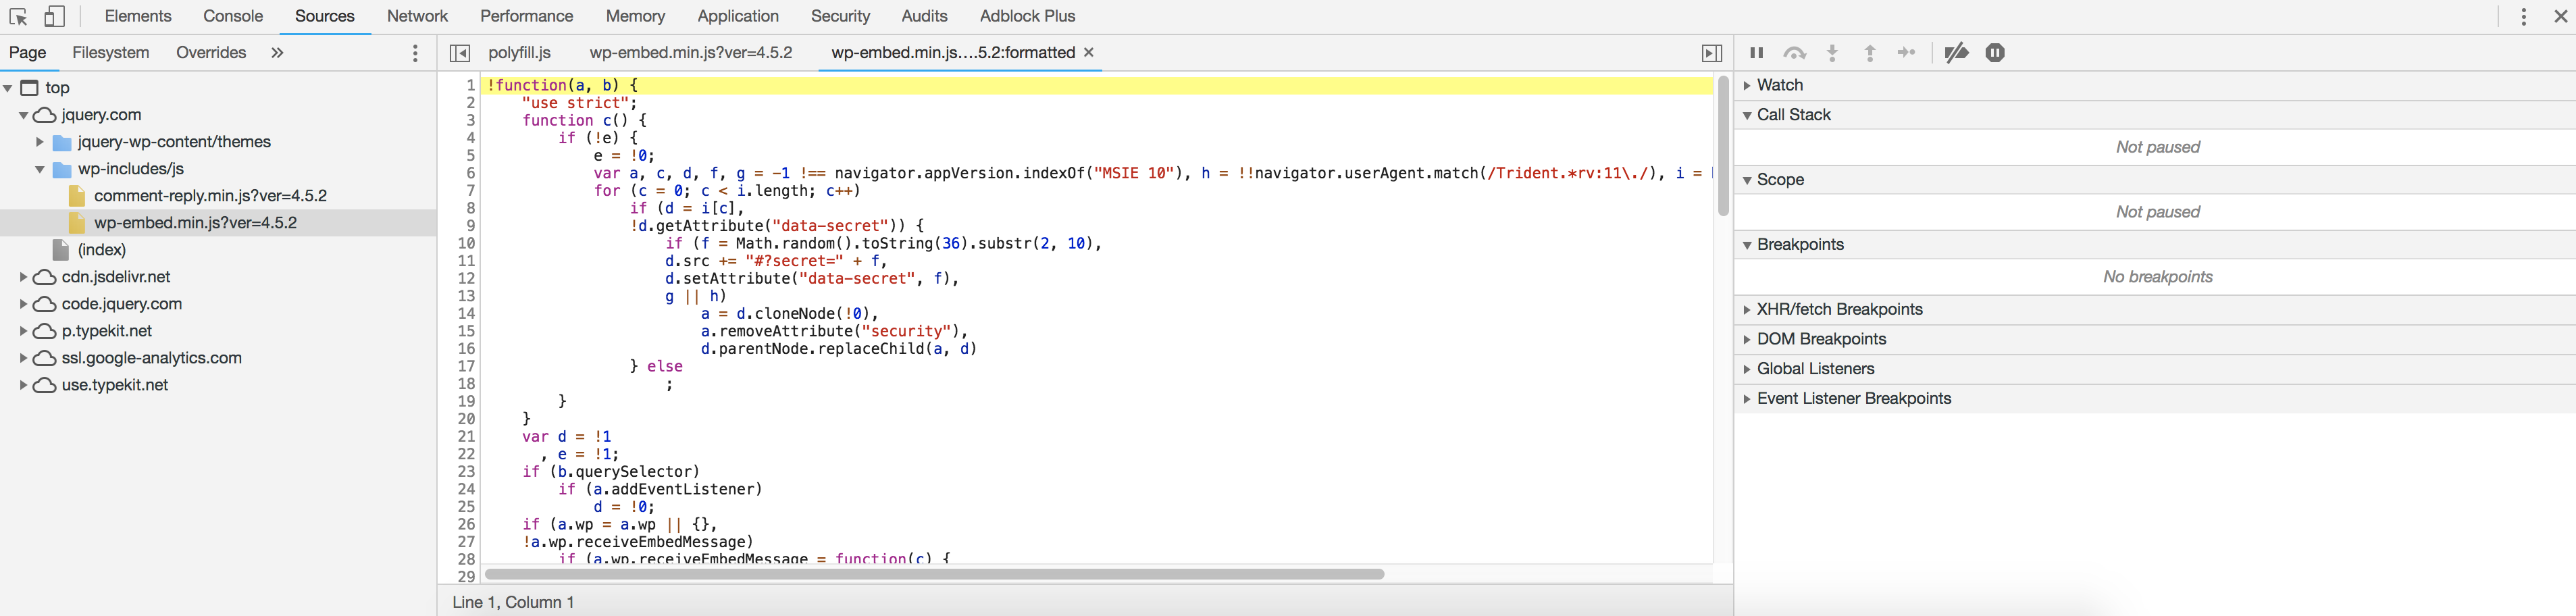
Pretty print
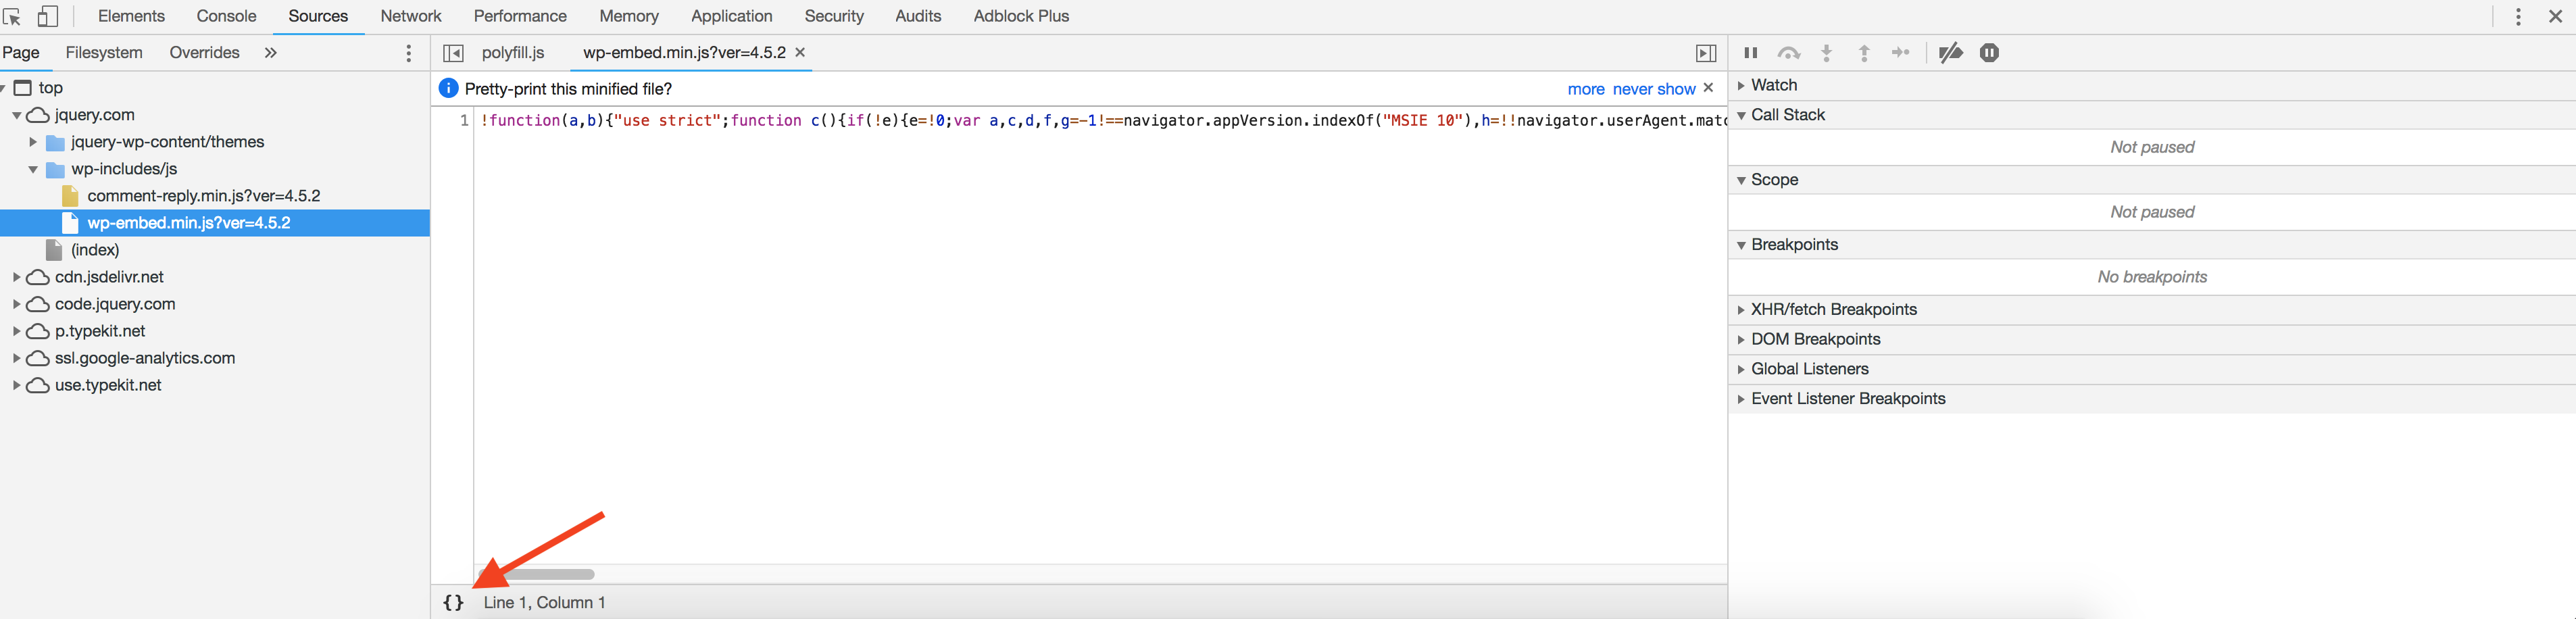
If you need to inspect/debug minified code (especially in production) devtools can pretty print the minified code by clicking on the curly braces in the bottom left corner of the main debugger window:
The pretty printed output is not as clean and useful than the original source code, but it is more understandable/debuggable than the minified version, it looks like this:
There are many more features of the devtools, if you are interested please check the official documentation here: https://developers.google.com/web/tools/chrome-devtools/javascript/
The post JavaScript debugging with Chrome DevTools appeared first on 42 Coders.

Top comments (0)